

Description
Power BI Training in Bangalore Offered by Locus IT with 100% Hands-on Practical Classes by the Best Industrial Experts with Real-time Projects.
Overview
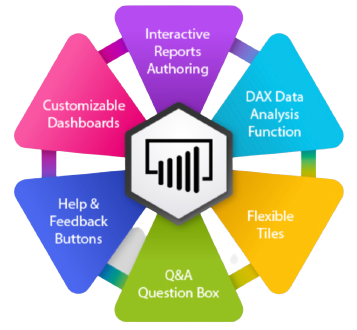
1: Power BI is a collection of software services and applications that let you connect to all sorts of data sources and create compelling visuals and reports. You can benefit from receiving those reports, or you can share them with others inside or outside your organization. Learn the basics of Power BI, how its services and applications work together, and how they can be used to create or experience compelling visuals and analytics based on your data.
In this module, you will:
a). Learn how Power BI services and applications work together.
b). Explore how Power BI can make your business more efficient.
c). Learn how to create compelling visuals and reports.
2: How can you find, collect, and clean data from different sources? Power BI is a tool for making sense of your data. You will learn tricks to make data gathering easier.
In this module, you will:
a). Explore the data-centric features and tools of Power BI.
b). Explore ways to find data.
3: Connect Power BI to multiple data sources to create reports. Define the relationship between your data sources.
In this module, you will:
a). Create relationships between your data sources
b). Create a new field with calculated columns
c). Optimize data by hiding fields and sorting visualization data
d). Create a measure to perform calculations on your data
e). Use a calculated table to create a relationship between two tables
f). Format time-based data so that you can drill down for more details
4: Create and customize visuals to present data in compelling and insightful ways.
In this module, you will:
a). Explore Power BI visuals
b). Create visuals
1: Get started building with Power BI
a). Introduction
b). Use PowerBI
c). Building blocks of PowerBI
d). Tour and use the PowerBI service
e). Summary
f). Check your knowledge
2: Get data with Power BI Desktop
a). Overview of PowerBI Desktop
b). Explore Power BI Desktop
c). Connect to data sources
d). Get data from Excel
e). Transform data to include in a report
f). Combine data from multiple sources
g). Clean data to include in a report
h). Check your knowledge
i). Summary
3: Model data in PowerBI
a). Introduction to modelling your data
b). How to manage your data relationships
c). Create calculated columns
d). Optimize data models
e). Create measures
f). Create calculated tables
g). Explore time-based data
h). Check your knowledge
i). Summary
4: Use visuals in Power BI
a). Introduction to visuals in PowerBI
b). Create and customize simple visualizations
c). Create slicers
d). Map visualizations
e). Matrices and tables
f). Create scatter, waterfall, and funnel charts
g). Modify colors in charts and visuals
h). Page layout and formatting
i). Check your knowledge
j). Summary
5: Explore data in PowerBI
a). Introduction to the PowerBI service
b). Quick insights into PowerBI
c). Create and configure a dashboard
d). Ask questions of your data with natural language
e). Create custom Q&A suggestions
f). Share dashboards with your organization
g). Display visuals and tiles in full-screen
h). Edit tile details and add widgets
i). Get more space on your dashboard
j). Check your knowledge
k). Summary
6: Publish and share in Power BI
a). Introduction to using workspaces
b). Publish PowerBI Desktop reports
c). Print and export dashboards and reports
d). Introducing PowerBI Mobile
e). Create workspaces in PowerBI
f). Build apps
g). Use apps
h). Integrate OneDrive for Business with PowerBI
i). Publish to web
j). Check your knowledge
k). Summary
For more inputs on Creating and using analytics reports with Power BI, you can connect here.
Contact the L&D Specialist at Locus IT.
Locus Academy has more than a decade of experience in delivering training/staffing on Analytics reports with Power BI for corporates across the globe. The participants for the training/staffing on Analytics reports with Power BI are extremely satisfied and can implement the learnings in their ongoing projects.


Reviews
There are no reviews yet.