


tried | tested | trusted
Industry Specific Analytics Solutions
Our healthcare solutions leverage our unparalleled data lake and advanced analytics to generate workflow-ready insights

Analytics is used in a higher education environment to analyze various collected data points to gain insight & make informed decisions.
Mall Analytics measures the quantity and quality of the relationship between malls and stores; optimizing Anchor Tenants and Tenant Mix.
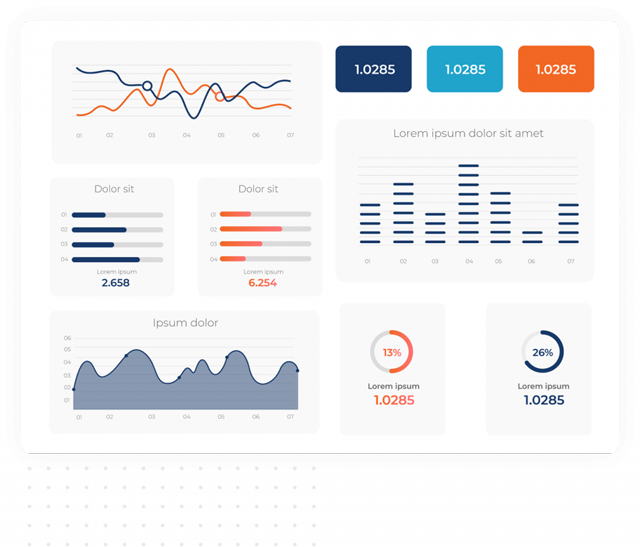
Data Visualization Challenges We Solve
Most of the objects in dataset are too relative to each other. Users cannot divide them as separate objects on the screen. Information loss: Reduction of visible data sets can be used, but leads to information loss.
- Overloaded dashboards
- Insufficient flexibility
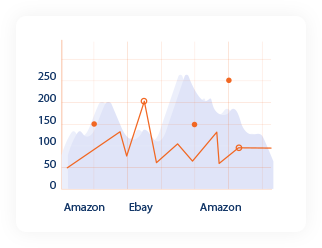
Big Data Analysis Challenges We Solve
You would be surprised to know that the amount of data being produced by large business enterprises is tremendously growing at a rate of 40 to 60% per year. Simply storing this voluminous amount of data is not going to be productive for your business.
- Disregarded user role
- Not insightful reports
Working Steps
How Team Locus Works
Plan & Verify
Plan, demonstrate and get it approved
Understand every user and his/her needs
Visualize
Visualize
Understand every user and his/her needs
Human Capital
Identify the right resources who can deliver


No excuses, no stories; meet the SLA
Meet the target
Meet the target
No excuses, no stories; meet the SLA
Stakeholders
Identify and keep them informed at all levels

Technology Partners with Industry Leaders
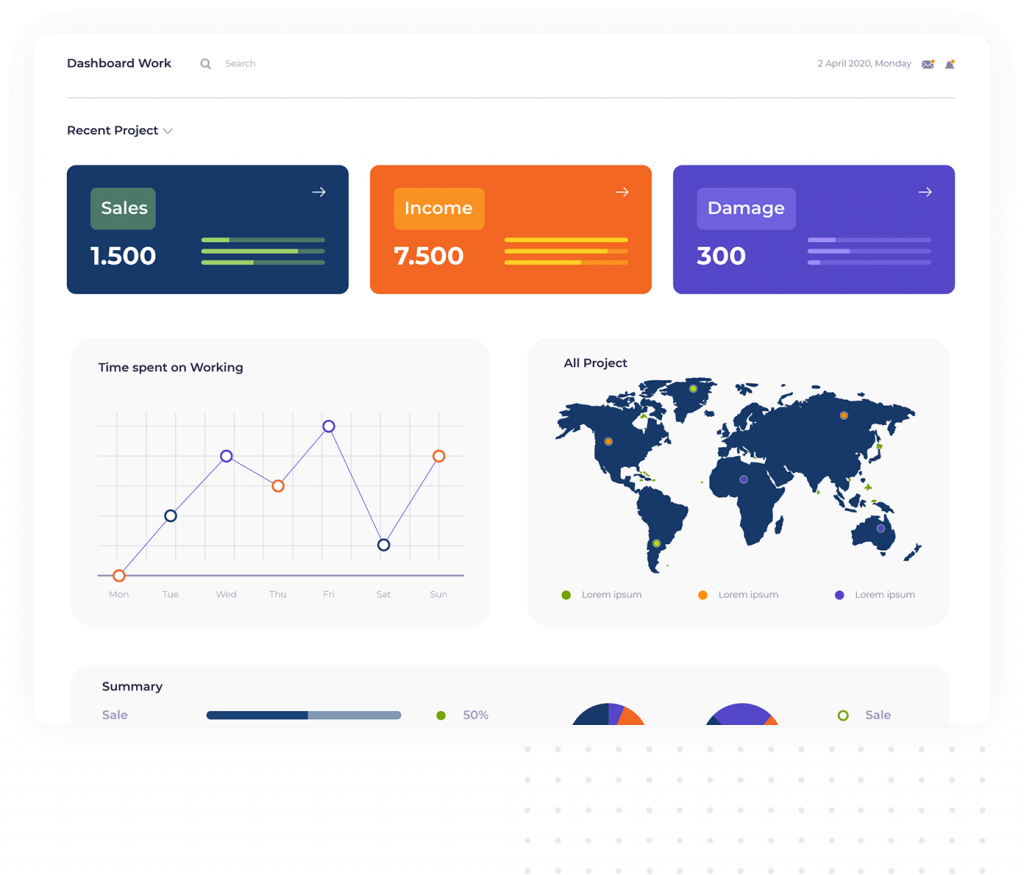
Tools We Use to Generate Data Visualization


What our customers say
Testimonials


Diving into the world of Technology
Tech Post @ Locus IT


We Like to Start Your Project With Us
We guarantee the committed service and meet the SLA with “No Compromise” attitude