Rs-service
IoT is a network of physical objects embedded with electronics, software, sensors, and connectivity to enable them to collect and exchange information via the internet. One of the benefits of this IoT data science technology is that it can provide real-time alerts and warnings.
Service Image
Rs-service
Data visualization is the graphical representation of information and data. By using visual elements like charts, graphs, and maps, data visualization tools provide an accessible way to see and helps to understand trends, outliers, and patterns in data captured.
Rs-service
Combines data and analysis to find meaning in and increase understanding of a situation, resulting in some competitive advantage for your business. Provides low-level understanding of an issue, giving you deeper insight into major mechanics related to your particular business.

Service Image

Data Visualization Challenges We Solve

When designers prioritize compelling imagery over accuracy, data visualizations deceive. To communicate data with integrity, designers must avoid common data visualization mistakes.

  • Overloaded dashboards
  • Disregarded user role
  • Insufficient flexibility
  • Not insightful reports
  • Misleading colour contrast
  • Improper use of 3D
  • Too much data
  • Omitting baselines
  • Truncating scale
  • Biased text descriptions
  • Confusing Correlations
  • Zooming in

When to us

Data Visualization

Since large numbers are so difficult to comprehend in any meaningful way, and many of the most useful data sets contain huge amounts of valuable data, data visualization has become a vital resource for decision-makers.

To take advantage of all this data, many businesses see the value of data visualizations in the clear and efficient comprehension of important information, enabling decision-makers to understand difficult concepts, identify new patterns, and get data-driven insights in order to make better decisions.

Stages

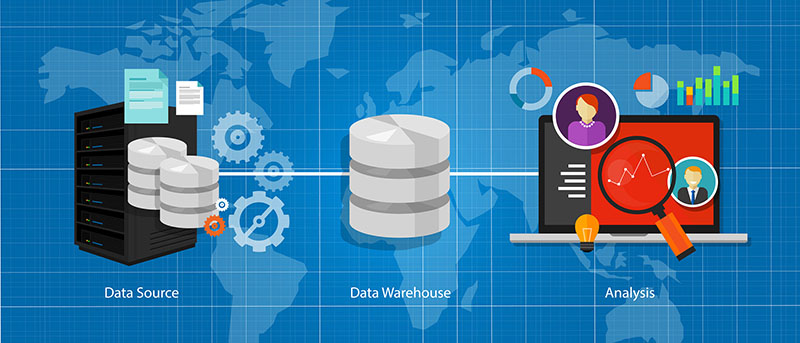
The five key stages of Business Intelligence:

  • Process Image

    Data sourcing

    BI is about extracting information from multiple sources of data & in multiple format

  • Process Image

    Data analysis

    Synthesising useful knowledge from collections of data including estimations

  • Process Image

    Situation awareness

    Filtering out irrelevant information, and setting the remaining useful information.

  • Process Image

    Risk assessment

    Discovering what plausible actions might be taken, or decisions made, at different times.

  • Process Image

    Decision support

    Business Intelligence is about using information wisely & Make right decisions

News & Update

Latest News & Blog

Satisfied clients

Customers We Work For

  • Logo
  • Logo
  • Logo
  • Logo
  • Logo
  • Client Image

    Locus helped us in understanding the data we gather at our business operations and built the data warehouse to generate effective and business friendly dashboards. Thank you team Locus

    • Food Processing Company | Bangalore
  • Client Image

    Collating the data from various sources (Bloomberg, Reuters, Core Banking System, CRM, etc) and analysing them to make right decisions was really a challenging task. Locus IT's team of experts really helped us to achieve what we wanted to.

    • Central Bank in African Country
  • Client Image

    As  a renowned FMCG brand in India; the volume of data generate at our stores are huge. We knew this data is helpful for us in reaching our customers close. Thank you Locus and you made it possible 👏👏👏👏

    • India’s Well Known FMCG brand

We Like to Start Your Project With Us

Call us or write to us; we will be right there