

Description
Introduction
Tableau is one of the most powerful and popular data visualization tools available today. It allows professionals to create interactive, insightful, and visually appealing reports and dashboards without needing extensive technical expertise. Mastering Tableau: Data Visualization and Analytics is a comprehensive course designed to take you from beginner to advanced level in Tableau, covering everything from connecting to data sources to building interactive dashboards and performing advanced analytics.
In this course, you will learn how to leverage Tableau’s capabilities to transform raw data into actionable insights, creating reports that drive business decisions. By mastering Tableau, you will be able to communicate data-driven insights in a visually compelling way, empowering your team or organization with better decision-making tools.
Prerequisites
- Basic understanding of data analysis concepts.
- Familiarity with spreadsheets or other data tools.
- No prior experience with Tableau is required, though a fundamental knowledge of SQL or relational databases is helpful.
Table of Contents
- Introduction to Tableau and Data Visualization
1.1 What is Tableau?
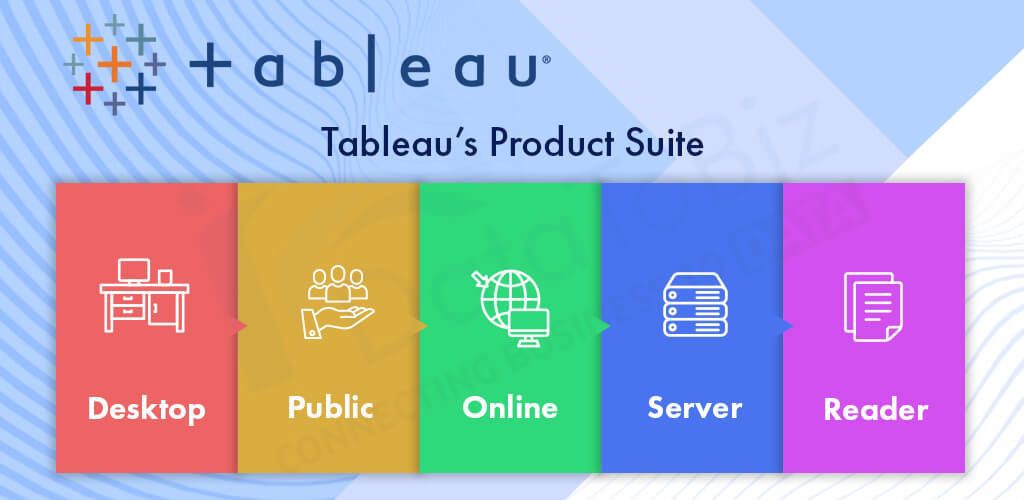
1.2 Key Features of Tableau Desktop, Server, and Online
1.3 Benefits of Data Visualization
1.4 Understanding Tableau’s Interface and Workflow
1.5 Types of Visualizations in Tableau - Connecting to Data Sources
2.1 Importing Data from Excel, CSV, and Other File Formats
2.2 Connecting to Databases (SQL, MySQL, PostgreSQL, etc.)
2.3 Connecting to Cloud Data Sources (Google Sheets, Salesforce, etc.)
2.4 Data Preparation and Cleaning in Tableau
2.5 Using Data Extracts vs Live Connections - Building Basic Visualizations
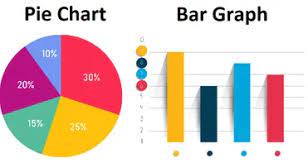
3.1 Creating Bar, Line, and Pie Charts(Ref: Mastering JasperSoft: Data Reporting and Business Intelligence)
3.2 Working with Scatter Plots and Histograms
3.3 Formatting and Customizing Visualizations
3.4 Working with Measures and Dimensions
3.5 Using Filters to Focus on Specific Data - Advanced Data Visualizations
4.1 Building Heat Maps, Tree Maps, and Packed Bubbles
4.2 Creating Dual-Axis Charts for Comparative Analysis
4.3 Using Geographic Maps and Geospatial Data
4.4 Visualizing Time Series Data and Trends
4.5 Creating Custom Calculations and Conditional Formatting - Creating Interactive Dashboards
5.1 Introduction to Dashboards and Their Benefits
5.2 Designing and Building Interactive Dashboards
5.3 Adding Filters, Parameters, and Actions to Dashboards
5.4 Using Dashboard Layouts and Best Practices
5.5 Mobile-Friendly Dashboards and Device-Specific Views - Advanced Tableau Features
6.1 Tableau Level of Detail (LOD) Expressions
6.2 Data Blending and Joins
6.3 Creating and Using Tableau Calculations
6.4 Working with Dynamic Sets and Groups
6.5 Time-Based Calculations and Window Functions - Performing Advanced Analytics
7.1 Trend Lines, Forecasting, and Statistical Analysis
7.2 Creating and Customizing Reference Lines and Bands
7.3 Using Predictive Analytics and Tableau Prep
7.4 Implementing What-If Analysis and Scenario Planning
7.5 Working with Clustering and Regression Analysis - Optimizing Tableau Workbooks and Dashboards
8.1 Performance Optimization Techniques
8.2 Best Practices for Managing Data Extracts
8.3 Reducing Workbook Size and Load Times
8.4 Handling Large Datasets in Tableau
8.5 Improving Dashboard Interactivity and Speed - Publishing and Sharing Visualizations
9.1 Publishing Workbooks to Tableau Server and Tableau Online
9.2 Sharing Dashboards and Reports with Stakeholders
9.3 Embedding Tableau Visualizations in Websites or Applications
9.4 Using Tableau Public for Public Data Sharing
9.5 Scheduling Report Delivery and Email Alerts - Real-World Applications and Case Studies
10.1 Case Study: Building a Sales Dashboard
10.2 Case Study: Visualizing Customer Segmentation Data
10.3 Case Study: Analyzing Financial Performance with Tableau
10.4 Case Study: Healthcare Analytics and Patient Data Reporting
10.5 Using Tableau in Marketing Campaign Analysis
Conclusion
By the end of Mastering Tableau: Data Visualization and Analytics, you’ll have a deep understanding of Tableau’s powerful features for visualizing and analyzing data. You’ll be proficient in designing insightful and interactive dashboards, applying advanced analytics techniques, and optimizing your Tableau workbooks for performance.
With this course, you will be well-equipped to communicate complex data insights clearly and effectively through dynamic visualizations, making data-driven decision-making accessible to your entire organization. Whether you’re working in business, finance, healthcare, or any other industry, mastering Tableau will provide you with the skills to deliver valuable insights that can drive meaningful change.


Reviews
There are no reviews yet.