

Description
Introduction
D3.js (Data-Driven Documents) is a powerful JavaScript library that enables developers to create interactive and dynamic data visualizations on the web. It allows the integration of data into HTML, SVG, and CSS, making it possible to create rich visual representations of complex datasets. With D3.js, you can build everything from simple charts to advanced interactive visualizations, and it offers full control over the visual aspects, making it one of the most flexible libraries available for data visualization.
This course will help you learn how to use D3.js for various visualization tasks, such as building charts, maps, and other graphical elements that interact with data in real-time. Whether you’re a beginner or looking to expand your knowledge, this course will guide you through the basics of D3.js, as well as advanced techniques for handling more complex datasets and building interactive web applications.
Prerequisites
- Basic understanding of HTML, CSS, and JavaScript
- Familiarity with web development concepts
- No prior experience with D3.js is necessary, but an interest in data visualization is essential
Table of Contents
- Introduction to D3.js
1.1 What is D3.js?
1.2 Overview of Data Visualization and Its Importance
1.3 D3.js vs Other Visualization Libraries
1.4 Setting Up Your D3.js Development Environment
1.5 Basic Structure of a D3.js Visualization - Understanding the Data in D3.js
2.1 Working with JSON and CSV Data Formats
2.2 Importing and Parsing Data in D3.js
2.3 Binding Data to DOM Elements
2.4 Exploring D3.js Data Manipulation Functions
2.5 Filtering and Sorting Data - Creating Basic Visualizations
3.1 Creating Bar Charts with D3.js
3.2 Building Line and Area Charts
3.3 Generating Pie and Donut Charts
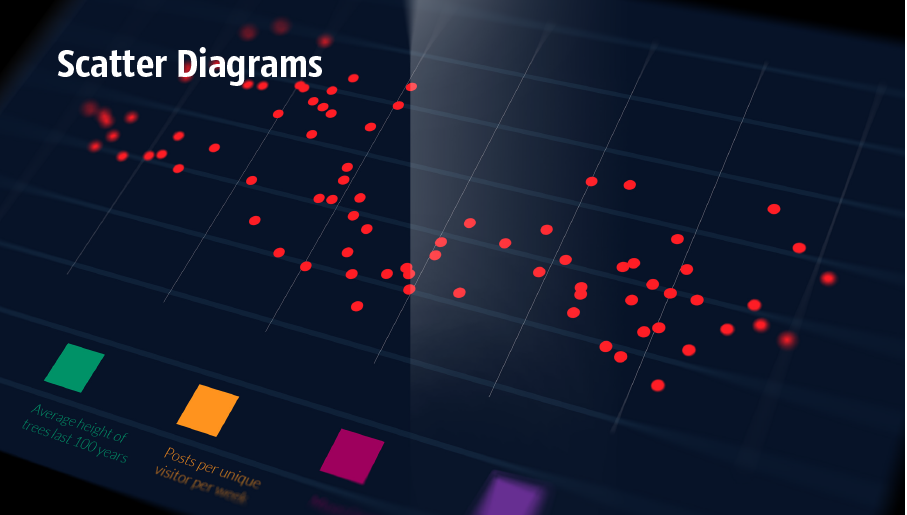
3.4 Creating Scatter Plots
3.5 Customizing the Axes and Labels - Interactivity and Animations
4.1 Adding Interactivity to Visualizations with Events
4.2 Hover Effects and Tooltips
4.3 Animating Transitions in D3.js
4.4 Using Dynamic Data Updates in Visualizations
4.5 Building Interactive Dashboards - Advanced Visualization Techniques
5.1 Working with Geographic Data: Mapping with D3.js
5.2 Building Choropleth Maps and Heatmaps
5.3 Creating Hierarchical Visualizations: Tree and Sunburst Diagrams
5.4 Visualizing Networks and Graphs with Force-Directed Layouts
5.5 Advanced Techniques for Customizing Shapes, Paths, and SVG - Advanced Data Handling and Performance Optimization
6.1 Efficient Data Handling for Large Datasets(Ref: Develop Deep-Learning Models using Pytorch & Neural Networks)
6.2 Using Web Workers for Performance Optimization
6.3 Lazy Loading and Virtualization Techniques
6.4 Integrating External Data Sources (APIs)
6.5 Optimizing Performance for Complex Visualizations - Integration with Web Technologies
7.1 Integrating D3.js with Other JavaScript Libraries
7.2 Using D3.js with React and Angular
7.3 Incorporating D3.js into Web Applications
7.4 Building D3.js Visualizations with Web APIs
7.5 Exporting Visualizations as Images and PDFs - Best Practices for Building D3.js Visualizations
8.1 Structuring Your Code for Maintainability
8.2 Writing Reusable D3.js Components
8.3 Debugging D3.js Visualizations
8.4 Designing for Responsiveness and Cross-Browser Compatibility
8.5 Documenting Your D3.js Projects - Deploying and Sharing Your D3.js Visualizations
9.1 Hosting D3.js Projects on GitHub Pages
9.2 Integrating Visualizations into Websites and Blogs
9.3 Sharing Interactive Visualizations with Users
9.4 Embedding D3.js Visualizations in Reports and Dashboards
9.5 Collaborative Projects: Sharing Code and Data - Conclusion
10.1 Recap of Key Concepts and Techniques
10.2 Real-World Applications of D3.js
10.3 Next Steps for Becoming a D3.js Expert
10.4 Further Learning Resources and Communities
10.5 Building Your Portfolio of D3.js Projects
Conclusion
D3.js is a versatile and powerful tool for creating sophisticated, data-driven visualizations. Through this course, you will have acquired the necessary skills to leverage D3.js for a wide range of data visualization projects, from simple charts to interactive, real-time web applications. Understanding how to manipulate and visualize data effectively will not only enhance your web development skills but also empower you to communicate complex data insights clearly and compellingly.
As you continue to explore D3.js, remember that the library’s flexibility and depth offer endless possibilities. Keep experimenting with different types of visualizations and integrating them into your projects. With practice, you’ll be able to transform data into valuable visual insights, improving both the usability and understanding of the data presented.


Reviews
There are no reviews yet.