

Description
Introduction
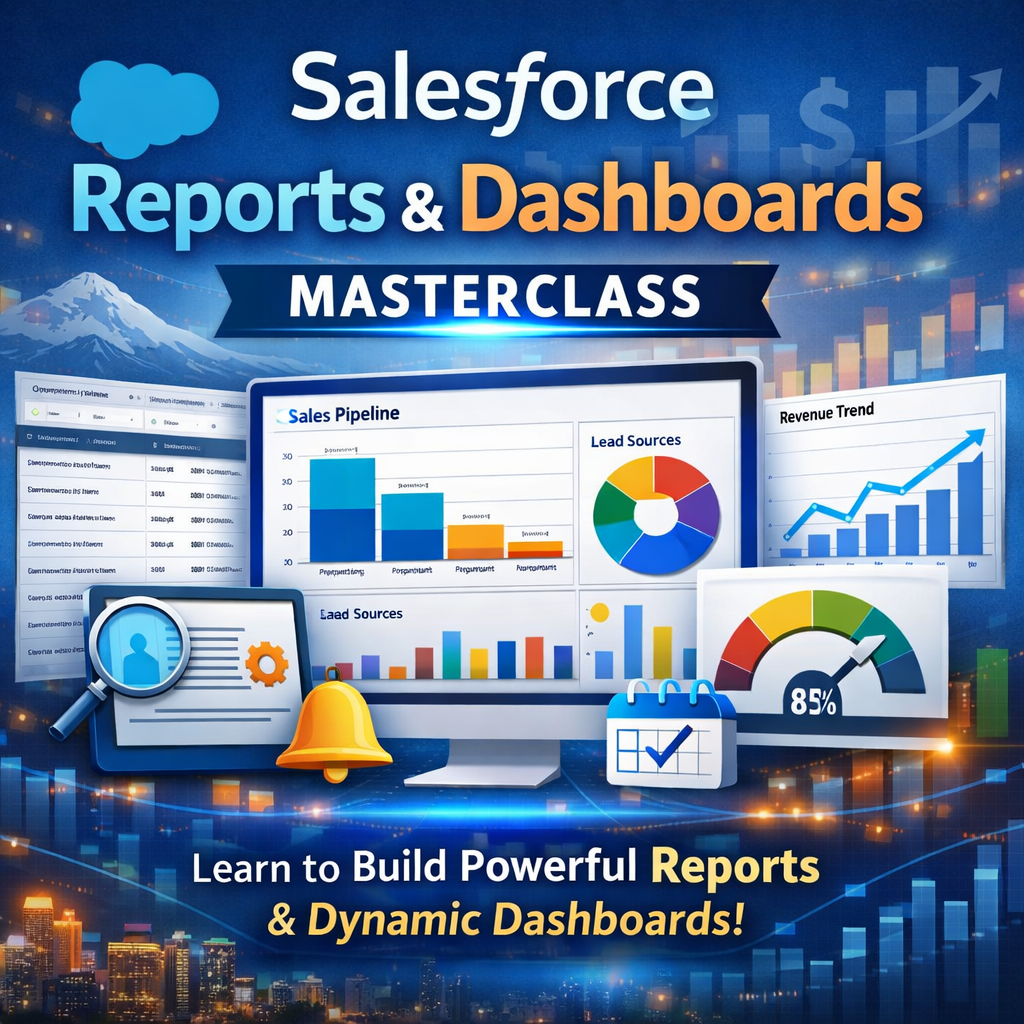
Salesforce Reports and Dashboards is a powerful analytics feature within the Salesforce platform that enables users to visualize, analyze, and track business data in real time. It allows organizations to create customized reports, interactive dashboards, and data-driven insights for better decision-making. This training focuses on building, customizing, and optimizing Salesforce reports and dashboards to improve sales, marketing, and service performance.
Learner Prerequisites
- Basic understanding of CRM concepts
- Familiarity with Salesforce platform navigation
- Knowledge of business data and reporting concepts
- Basic understanding of data analysis principles
- Awareness of sales, marketing, or customer service workflows
- Interest in business intelligence and analytics
Table of Contents
1. Introduction to Salesforce Reporting and Analytics
1.1 Overview of Salesforce reporting tools
1.2 Importance of data-driven decision making
1.3 Types of reports in Salesforce
1.4 Role of dashboards in business intelligence
1.5 Real-world use cases of Salesforce analytics
2. Salesforce Report Builder Basics
2.1 Introduction to Report Builder interface
2.2 Understanding report types
2.3 Creating basic reports in Salesforce
2.4 Filtering and sorting report data
2.5 Saving and managing reports
3. Report Formats and Structures
3.1 Tabular reports overview
3.2 Summary reports usage
3.3 Matrix reports explanation
3.4 Joined reports concept
3.5 Choosing the right report format
4. Advanced Report Customization
4.1 Grouping and bucketing data
4.2 Custom formulas in reports
4.3 Cross filters and field filters
4.4 Conditional highlighting
4.5 Dynamic report customization techniques
5. Building Salesforce Dashboards
5.1 Introduction to dashboards
5.2 Dashboard components and structure
5.3 Creating dashboard charts and graphs
5.4 Adding report components to dashboards
5.5 Saving and sharing dashboards
6. Dynamic Dashboards and Real-Time Data
6.1 Understanding dynamic dashboards
6.2 User-based data visibility
6.3 Real-time data updates
6.4 Dashboard refresh scheduling
6.5 Performance considerations
7. Advanced Dashboard Features
7.1 Interactive dashboard components
7.2 Drill-down capabilities
7.3 Dashboard filters and parameters
7.4 Embedding dashboards in Salesforce pages
7.5 Mobile dashboard optimization
8. Data Management for Reporting
8.1 Data source selection in Salesforce
8.2 Data accuracy and consistency
8.3 Handling large datasets
8.4 Report performance optimization
8.5 Data security in reports
9. Sharing and Collaboration
9.1 Sharing reports with users and teams
9.2 Setting report permissions
9.3 Dashboard sharing options
9.4 Subscription and scheduling reports
9.5 Collaboration best practices
10. Real-World Applications of Salesforce Analytics
10.1 Sales performance tracking
10.2 Marketing campaign analysis
10.3 Customer service reporting
10.4 Revenue forecasting dashboards
10.5 Executive business reporting
11. Best Practices and Optimization
11.1 Designing efficient reports
11.2 Improving dashboard performance
11.3 Avoiding common reporting errors
11.4 Maintaining scalable reporting structures
11.5 Governance and compliance in reporting
Conclusion
This training provides a complete understanding of Salesforce Reports and Dashboards. It explains how to build, customize, and manage reports for business insights. Moreover, learners gain practical skills in creating interactive dashboards. As a result, they can effectively use Salesforce analytics for data-driven decision-making.


Reviews
There are no reviews yet.