

Description
Power BI is a new cloud-based BI service provided by Microsoft and derived from its years of experience in relational databases like Access, SQL server.
Objectives :
Requirements
a). Introduction of BI:
1. Why BI?
2. Applications of BI
3. Introduction to the Course Instructor
4. Introduction to the Course and Mini-Projects
5. BI Project Overview
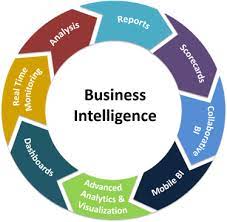
b). Types of Business Intelligence Tools and Applications:
1. Ad hoc analysis
2. Online Analytical processing
3. Mobile BI
4. Real-time BI
5. Operation Intelligence
6. Open-Source BI
7. Embedded BI
8. Collaborative BI
9. Location Intelligence
10. Business intelligence vendors and market
c). Statistics Overview
1. Welcome to the Statistics Course
2. Descriptive Statistics
2.1 Data Types
2.2 Level of Measurement
2.3 Numerical and Categorical Variables
2.4 Scatter Plot, Cross Table, and Histogram
2.5 Mode, Median, and Mean
2.6 Coefficient of Variation, Standard Deviation, and Variance
2.7. Skewness, Covariance, and Correlation
3. Inferential Statistics
3.1. What Is Inferential Statistics?
3.2. Distribution, Normal Distribution, and Standard Normal Distribution
3.3. What Is a Standard Error?
3.4. Estimators and Estimates
3.5. What Is the Central Limit Theorem?
4. Overview of Confidence Intervals
4.1. What Are Confidence Intervals?
4.2. Clarifications and Margin of Error
4.3. Z-Score
4.4. T-Score and Student’s T Distribution
4.5. Dependent Samples, Two Mean Test
4.6. Independent Samples, Two Mean Test
5. Hypothesis Testing
5.1. Null vs. Alternative Hypothesis
5.2. Error Types
5.3. Rejection Region, Significance Level, and P-Value
5.4. Population Variance Known
5.5. Population Variance Unknown
5.6. Dependent and Independent Samples for Mean Test
d). Statistical Practices Using Excel
1. Descriptive Statistics
2. Measures of Central Tendency
3. Data Spread
4. Data Visualization
5. Correlation
6. Paired Sample T-Test
7. T-Test for Equal and Unequal Variances
8. Confidence Interval
9. Hypothesis Testing
10. Example Project: Regression Analysis
e). Power BI
1. Introduction to Power BI
1.1 Power BI Overview
1.2 Installation
2. Data Sources
2.1 Introduction to Data Sources
2.2 Query Editor
2.3 Importing Files
2.4 Data Modeling
2.5 Lookup Data Tables
2.6 Active vs. Inactive Relationships
2.7 Roles
2.8 Refreshing Data and Hierarchies
3. Data Modeling
3.1 Introduction
3.2 DAX
3.3 Calculated Columns
3.4 Measures
3.5 Complex Functions
3.6 Hybrid Measures
3.7 Star Schema
3.8 Snowflake Schema
3.9 Filter flow
3.10 Bi-directional Cross-filtering
3.11 Time Intelligence
3.12 Defining Day and Date Function
3.12 Making Your Date Table
4. Design and Interactive Reports
4.1 Adding Visuals
4.2 Adding Measures to Reports
4.3 Applying Basic Filtering
4.4 Slice and Dice
4.5 Apply Formatting
5. Dashboard
5.1 Add Data to the Dashboard
5.2 Format the Dashboard
5.3 Publish Dashboard to Workspace
6. Career Opportunities with Power BI
f). Tableau
1. Introduction to Tableau
1.1. Tableau Overview
1.2. Installation
2. Tableau Fundamentals: Data Sources, First Bar Chart Graph
2.1. Exciting Challenge
2.2. Excel / CSV File Connection with Tableau
2.3. Tableau Navigation Overview
2.4. Establish Fields
2.5. Addition of Colors, Labels, and Formatting
2.6. Final Worksheet Exportation
3. Overview of Different Terms
3.1. Overview
3.2. Understand the Extracted Data
3.3. Knowledge of Aggregation, Granularity, and Time-Series
3.4. Level of Detail
3.5. Working with Charts and Filter
4. Overview of First Dashboard, Maps, and Scatter Plots
4.1. Overview
4.2. Joins and Relationship
4.3. Data Joining
4.4. Map Creation
4.5. Scatter Plot Creation
4.6. First Dashboard Creation with Highlighting and Filters
5. Overview of Dual-axis Chart, Joining, Relationship, and Blending
5.1. Overview
5.2. Working with Joins
5.3. Joining with Different Conditions, i.e., Multiple Fields and Duplicate Values
5.4. Difference Between Blending and Joining Data
5.5. Working on Blending Data
5.6. Creation of Dual Axis Chart
5.7. Understanding of Calculated Fields
5.8. Another Exciting Challenge with a Data Set
5.9. Model Dataset
5.10. Understanding of Relationship Data
6. Overview of New Dashboard
6.1. Overview
6.2. Dataset
6.3. Understanding of Mapping
6.4. Table Calculations: For Age
6.5. Table Calculations of Bins and Distribution
6.6. Power Parameters
6.7. Treemap map chart
6.8. New Dashboard
7. Updated Way of Data Preparation
7.1. Overview&amp;amp;amp;amp;amp;amp;amp;lt;/p></p>
7.2&
lt;/p><p>. Data Format and Data Interpreter<p><strong>&lt;strong>8. Overview of New Design Feature and Many More&lt;/strong></p>
9. Advancement in Tableau
g). Real-Time Projects
1. Sales Dashboard Using Power BI (Dashboard)
2. Customer Analysis Using Tableau (Dashboard)
h). Career Development
1. Preparing for the Interview
2. Roles in Business Intelligence
3. Market Value of Various BI Roles Worldwide
For more inputs on Bussiness Intelligence with Power BI and Tableau you can connect here.
Contact the L&D Specialist at Locus IT.
Locus Academy has more than a decade experience in delivering the training/staffing on Business Intelligence with Power BI for corporates across the globe. The participants for the training/staffing on Business Intelligence with Power BI are extremely satisfied and are able to implement the learnings in their on going projects.


Reviews
There are no reviews yet.