

Description
Introduction
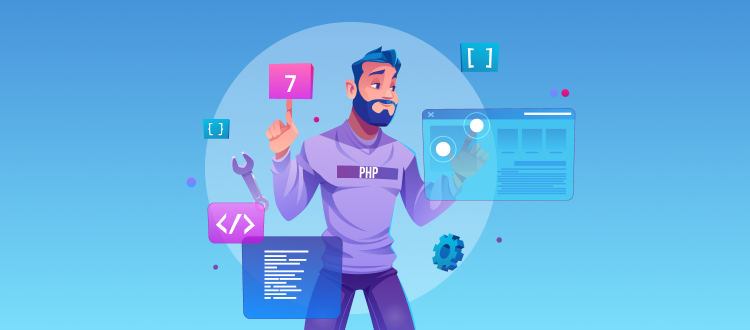
Debugging is an essential skill for any developer, and mastering the debugging tools available can drastically improve development efficiency. NuSphere PhpED is a robust integrated development environment (IDE) tailored for PHP developers, offering a powerful debugger to streamline the process of identifying and resolving issues in code.
This course, Mastering PHP Debugger in NuSphere PhpED: A Complete Guide, provides an in-depth understanding of PhpED’s debugging features, including breakpoints, watch variables, and step-through debugging. By the end of the course, learners will have the expertise to troubleshoot and optimize PHP applications with ease, making their development process faster and more effective.
Prerequisites
- Basic knowledge of PHP programming.
- Familiarity with web development concepts.
- Access to NuSphere PhpED IDE (trial or licensed version).
Table of Contents
- Introduction to PhpED Debugger
1.1 Overview of NuSphere PhpED Features
1.2 Setting Up the Development Environment
1.3 Introduction to the PHP Debugger in PhpED
1.4 Benefits of Debugging with PhpED - Installing and Configuring PhpED
2.1 Downloading and Installing NuSphere PhpED
2.2 Configuring the Debugger for Local Development(Ref: Mastering Shopify: Building and Managing E-Commerce Stores)
2.3 Setting Up Remote Debugging Environments
2.4 Integrating PhpED with Web Servers and Databases - Getting Started with PhpED Debugger
3.1 Understanding Debugging Concepts (Breakpoints, Watches, etc.)
3.2 Setting Breakpoints and Conditional Breakpoints
3.3 Running Debug Sessions
3.4 Navigating the Debugger Interface - Working with Variables and Watches
4.1 Viewing and Modifying Variables During Execution
4.2 Adding Watch Expressions for Monitoring Variables
4.3 Understanding Variable Scopes in PhpED
4.4 Handling Complex Data Structures (Arrays and Objects) - Step-Through Debugging Techniques
5.1 Stepping Into, Over, and Out of Functions
5.2 Using the Call Stack to Trace Function Execution
5.3 Analyzing Execution Flow for Debugging Logic Errors
5.4 Debugging Recursive Functions and Loops - Advanced Debugging Features
6.1 Debugging AJAX and Asynchronous PHP Code
6.2 Handling Exceptions and Errors in PhpED
6.3 Using PhpED Debugger with PHP Frameworks (e.g., Laravel, Symfony)
6.4 Debugging CLI PHP Scripts - Remote Debugging with PhpED
7.1 Setting Up a Remote Server for Debugging
7.2 Configuring PhpED for Remote Debugging Sessions
7.3 Debugging PHP Applications Deployed on a Server
7.4 Troubleshooting Remote Debugging Issues - Performance Optimization with PhpED
8.1 Identifying Bottlenecks in PHP Code
8.2 Using PhpED’s Profiler for Performance Analysis
8.3 Optimizing Code Based on Profiler Reports
8.4 Best Practices for Writing Optimized PHP Code - Integrating PhpED Debugger with Other Tools
9.1 Using PhpED with Version Control Systems (Git, SVN)
9.2 Debugging PHP in PhpED with Xdebug Integration
9.3 Extending PhpED Functionality with Plugins - Real-World Debugging Scenarios
10.1 Debugging a Login Authentication System
10.2 Resolving Issues in Database Queries and Connections
10.3 Fixing Frontend and Backend Communication Errors
10.4 Debugging Third-Party API Integrations - Best Practices for Debugging
11.1 Tips for Efficient Debugging in PhpED
11.2 Common Mistakes and How to Avoid Them
11.3 Establishing a Debugging Workflow - Project: Debugging a Complex PHP Application
12.1 Setting Up the Project for Debugging
12.2 Identifying and Resolving Bugs in Real-Time
12.3 Optimizing the Application’s Performance
12.4 Documenting Debugging and Optimization Outcomes - Conclusion
13.1 Summary of Key Debugging Techniques
13.2 Final Thoughts on PhpED Debugger’s Capabilities
13.3 Resources for Further Learning
13.4 Tips for Continuous Debugging Mastery
Conclusion
Mastering PHP Debugger in NuSphere PhpED: A Complete Guide empowers developers to effectively troubleshoot and optimize PHP applications. By gaining proficiency in PhpED’s debugging features, learners can significantly reduce development time, minimize errors, and enhance the quality of their applications.
With the skills acquired in this course, you are well-equipped to tackle complex debugging challenges and streamline your PHP development process. Embrace the power of PhpED and elevate your programming expertise to new heights!


Reviews
There are no reviews yet.