Description
Introduction
JasperSoft is a leading open-source business intelligence (BI) suite designed to provide powerful reporting, data visualization, and analytics capabilities. Mastering JasperSoft: Data Reporting and Business Intelligence is a comprehensive course designed to help professionals learn how to create insightful reports, dashboards, and interactive data visualizations. This course takes you through the advanced features of JasperSoft, enabling you to harness the full potential of data reporting to drive business decisions.
By mastering JasperSoft, you’ll be equipped to transform raw data into actionable insights and deliver high-quality, data-driven reports that can improve operational efficiency and business intelligence.
Prerequisites
- Basic knowledge of SQL and relational databases.
- Familiarity with data analysis concepts and reporting tools.
- Experience using or a strong desire to learn JasperSoft software and its various components.
Table of Contents
- Introduction to JasperSoft BI Suite
1.1 Overview of JasperSoft and Its Key Components
1.2 Understanding JasperReports Server
1.3 Installing and Configuring JasperSoft Studio and JasperReports Server
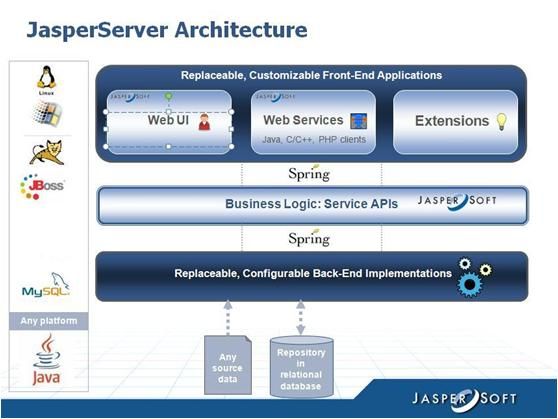
1.4 Architecture and Components of JasperSoft BI Suite - Creating and Designing Reports
2.1 Introduction to Report Design and Layout
2.2 Working with Data Sources and Data Adapters
2.3 Creating Basic Reports with JasperSoft Studio
2.4 Using Subreports for Complex Data Structures
2.5 Customizing Report Styles and Formatting - Working with Advanced Report Features
3.1 Conditional Formatting and Styling in Reports
3.2 Parameterized Reports for Dynamic Data Viewing
3.3 Utilizing Expressions for Dynamic Calculations(Ref: Mastering Tableau: Data Visualization and Analytics)
3.4 Grouping, Sorting, and Aggregating Data in Reports
3.5 Exporting Reports to Various Formats (PDF, Excel, HTML, etc.) - Interactive Dashboards and Visualizations
4.1 Introduction to Dashboards and Visualization Concepts
4.2 Building Interactive Dashboards Using JasperReports Server
4.3 Integrating Graphs and Charts into Dashboards
4.4 Using Drill-Down and Drill-Through for Enhanced Interactivity
4.5 Embedding Dashboards into Web Applications - Integrating JasperSoft with Databases and Other Data Sources
5.1 Connecting JasperSoft to Relational Databases (SQL Server, MySQL, etc.)
5.2 Connecting JasperSoft to NoSQL Data Sources (MongoDB, Cassandra)
5.3 Integrating External Data Using Web Services and REST APIs
5.4 Working with Multi-Source Data Integration - Advanced Report Development Techniques
6.1 Using Complex Queries for Report Generation
6.2 Customizing Report Templates for Reusability
6.3 Dynamic Report Generation Using Subqueries and Joins
6.4 Utilizing Custom Functions and Libraries in Reports - JasperSoft Server Administration
7.1 Configuring JasperReports Server for Optimal Performance
7.2 Managing Users, Roles, and Permissions
7.3 Scheduling and Automating Report Generation
7.4 Managing Report Execution and Security
7.5 Handling Report Caching and Optimizing Performance - Data Security and Compliance in JasperSoft
8.1 Securing Data Connections and User Access
8.2 Role-Based Access Control in Reports and Dashboards
8.3 Ensuring Compliance with Data Privacy Regulations (GDPR, HIPAA, etc.)
8.4 Implementing Encryption and Secure Authentication in JasperSoft - Extending JasperSoft with Custom Features
9.1 Writing Custom Data Sources for JasperSoft Reports
9.2 Creating Custom Report Components (Charts, Tables, etc.)
9.3 Using JasperSoft APIs for Automation and Integration
9.4 Extending the JasperSoft Studio IDE with Plugins - Best Practices and Real-World Use Cases
10.1 Best Practices for Report Design and Optimization
10.2 Case Study: Building Financial Dashboards
10.3 Case Study: Healthcare Reporting with JasperSoft
10.4 Building Multi-Tenant Solutions Using JasperSoft
10.5 Using JasperSoft for Real-Time Business Intelligence and Analytics
Conclusion
By the end of Mastering JasperSoft: Data Reporting and Business Intelligence, you’ll have gained a deep understanding of how to effectively design, manage, and optimize reports and dashboards using the JasperSoft suite. You’ll be able to use advanced features like parameterized reports, custom visualizations, and multi-source data integration to enhance business decision-making.
With this course, you will not only master the art of data reporting but also gain the skills to integrate, automate, and optimize BI solutions in real-world environments, making you a key player in your organization’s data analytics strategy.





Reviews
There are no reviews yet.