

The platform behind Power BI and ValQ Solution For Pharamaceutical companies data
The platform OF Power BI and ValQ Solution For Pharamaceutical companies is leveraging for POC—which took 10 days to implement—takes all source data and moves it to the Azure environment. Source data is loaded via Azure Data Factory into Azure Data Lake Storage Gen2 for storage. From there data transformation is processed via Azure Databricks and Azure Machine Learning in two stages.
Stage one involves the necessary steps to make the data fit for purpose, which are to:
- Clean and purge
- Organize and structure
- Establish relationships
- Apply business logic
- Model to support analysis
The second stage builds on this through leveraging the data platform functions that:
- Automate tasks
- Generate analytics and insights
- Detect anomalies
- Simulate model changes
- Predict
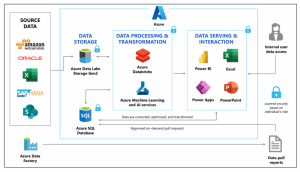
This data manipulation and transformation is the key to the entire application development process. The data serving and interaction layer leverages Microsoft Power Platform whereby the solution uses Power BI to present the data and Power Apps to allow user interaction with the data. Whether a user pulls data in from the Power BI dashboards or Excel, the information will be the same because of the existing data transformation process.
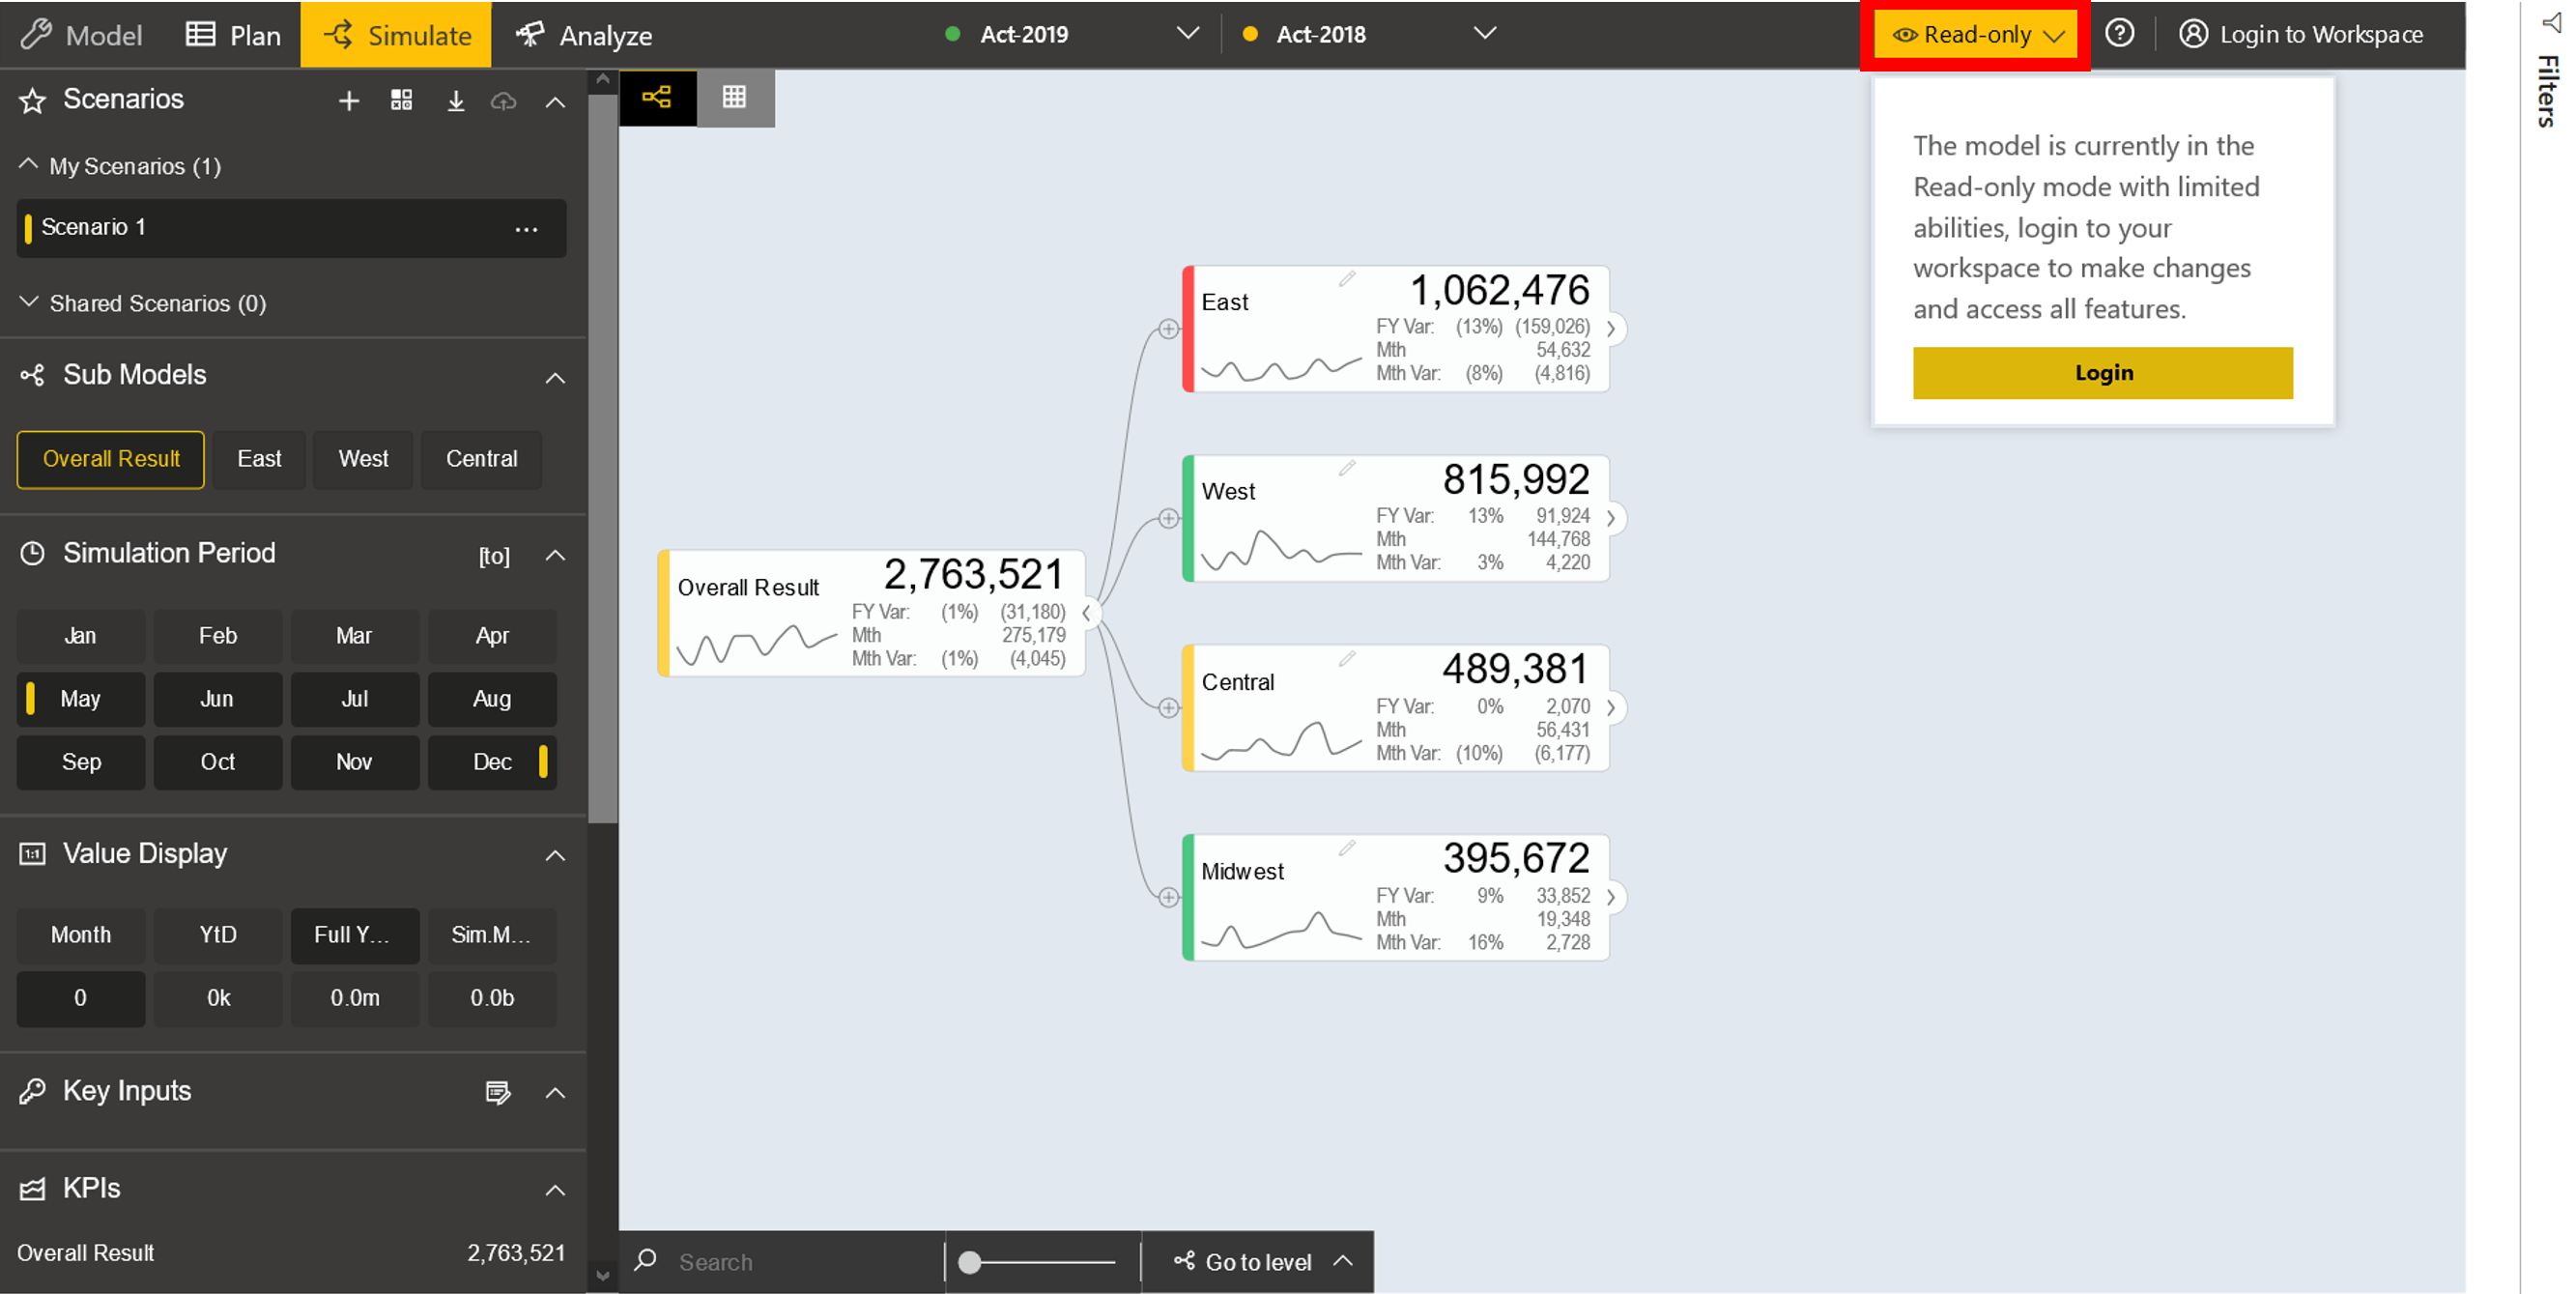
The next key element in the company’s solution is the integration of Visual BI’s planning tool, ValQ. The simulation capability begins with a demand signal while volume assumptions flow downward to trigger each process.
Fortune 500 pharmaceutical company uses Power BI to solve planning challenge
The US-based Fortune 500 pharmaceutical company faced challenges with fragmented data that involved sorting through multiple data sources (i.e., Excel, flat file, SAP, and other cloud-based systems) engaged with a disjointed toolset. These barriers prevented access to critical information which made it increasingly difficult to perform the economic modeling and evaluation along with metrics calculations.
The finance director for supply chain management within the company was looking for a way to provide much deeper end-to-end analysis of the demand/delivery cycle to understand cost drivers and other performance metrics. This solution would enable insight into the actionable areas of the business that are driving the economics and therefore the finances reported in their financial results.
Ultimately, their Power BI and ValQ Solution For Pharamaceutical companies solution needed to unify a significant amount of disparate data in a coherent manner, that would allow them to perform predictive modeling to understand financial implications of certain actions prior to execution.
Power BI’s low-code reporting visualization was suitable for the company’s finance director to begin work on the proof of concept. Because of its flexibility, security, and functionality it would also scale well further into implementation. Also, Power BI’s data modeling and data source connection capabilities made it a no-brainer tool for their solution. Most importantly, Power BI supported the planning capabilities the director needed through the partnership with Visual BI, and their ValQ application, which delivers forecasting, simulations, and performance analysis.
Reference to the more content available here https://powerbi.microsoft.com/en-in/blog/fortune-500-pharmaceutical-company-leverages-power-bi-and-valq-for-strategic-planning/