

Description
Introduction to Grafana Dashboards
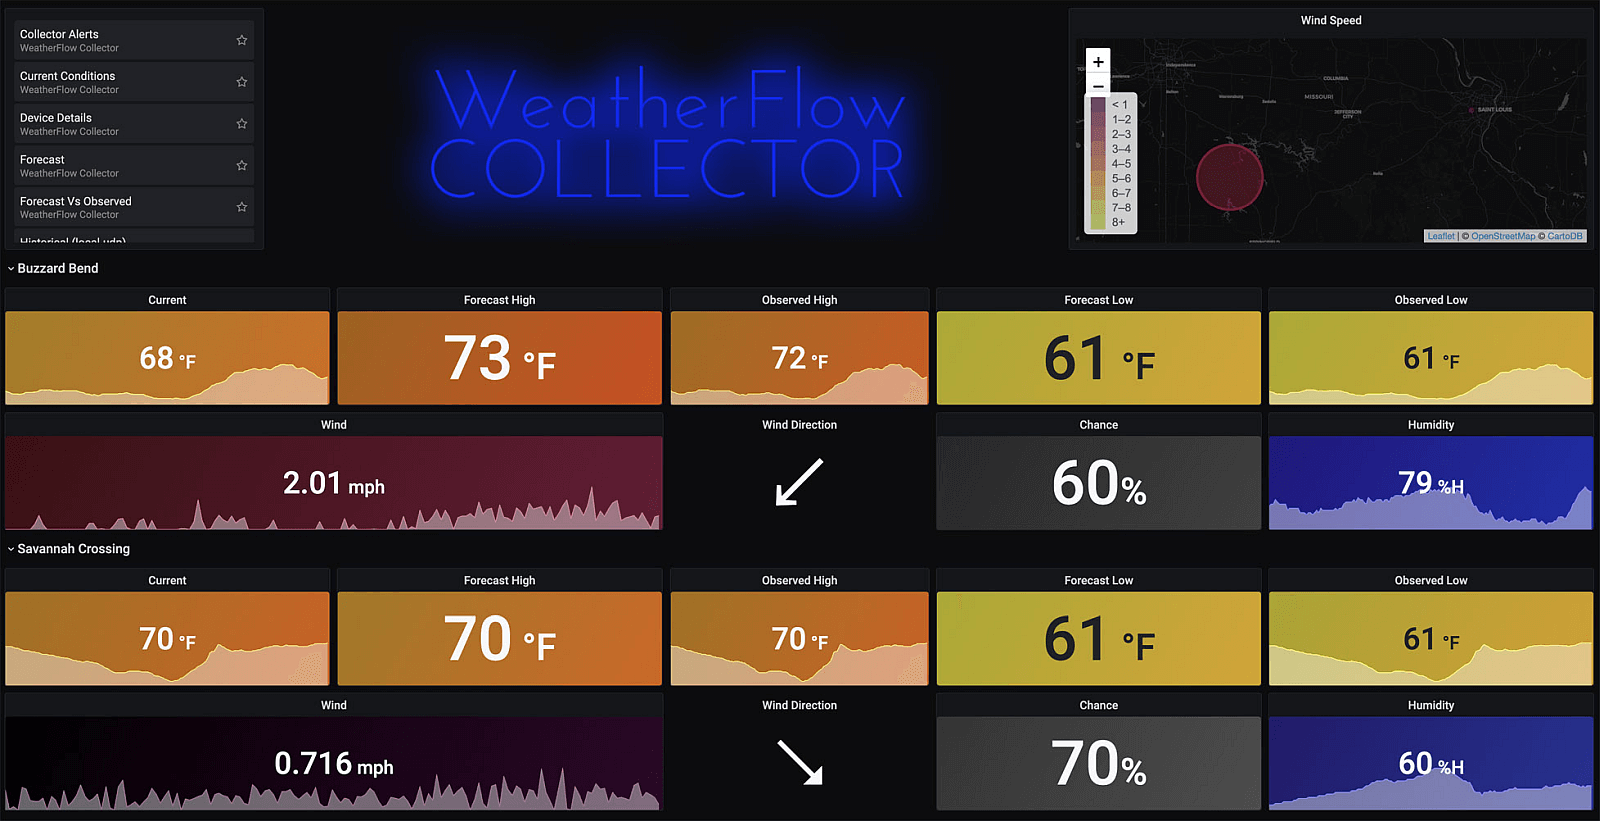
Grafana Dashboards are powerful tools for visualizing and analyzing data from various sources in real time. It allows users to create dynamic and customizable dashboards that display metrics, logs, and other data in visually appealing formats like graphs, tables, and heatmaps. It integrates seamlessly with multiple data sources, making it an essential platform for monitoring applications, infrastructure, and business metrics.
Prerequisites
- Basic Knowledge of Data Visualization: Understanding the principles of data visualization and why it’s important.
- Familiarity with Grafana: Some prior exposure to it’s interface and features is beneficial.
- Understanding of Data Sources: Knowledge of data sources (e.g., Prometheus, InfluxDB, Elasticsearch) that can be integrated with Grafana.
- Basic SQL Knowledge: Familiarity with querying databases can help in retrieving relevant data for visualization.
- Technical Skills: Basic skills in programming or scripting (e.g., JSON) may be useful for advanced customizations.
TABLE OF CONTENT
1: Introduction
1.1 Overview of Grafana
1.1.1 What is Grafana?
1.1.2 Key features and benefits
1.1.3 Use cases
1.2 Installing and Configuring Grafana
1.2.1 System requirements
1.2.2 Installation process
1.2.3 Configuring data sources
2: Getting Started with Dashboards
2.1 Understanding Dashboards in Grafana
2.1.1 Components of a dashboard
2.1.2 Dashboard layout and structure
2.2 Creating Your First Dashboard
2.2.1 Adding panels
2.2.2 Configuring panel options
2.2.3 Dashboard settings
3: Data Sources and Queries
3.1 Configuring Data Sources
3.1.1 Supported data sources
3.1.2 Adding data sources to Grafana
3.2 Building Queries
3.2.1 Querying time-series data
3.2.2 Using variables in queries
3.2.3 Advanced query options
4: Visualization Options
4.1 Panel Types and Options
4.1.1 Time-series panels
4.1.2 Singlestat panels
4.1.3 Table panels
4.1.4 Graph panels
4.2 Customizing Visualizations
4.2.1 Color schemes and thresholds
4.2.2 Annotations and events
5: Advanced Dashboard Features
5.1 Templating
5.1.1 Variable types and usage
5.1.2 Dynamic dashboards with templating
5.2 Alerts and Notifications
5.2.1 Setting up alerts
5.2.2 Notification channels
6: Best Practices and Optimization
6.1 Dashboard Design Best Practices
6.1.1 Organizing panels and rows
6.1.2 Consistent layout and styling
6.2 Performance Optimization
6.2.1 Query optimization
6.2.2 Caching strategies
7: Integrations and Plugins
7.1 Integrating Grafana with Other Tools
7.1.1 Prometheus integration
7.1.2 InfluxDB integration(Ref: Spring Integration)
7.2 Using Grafana Plugins
7.2.1 Installing and configuring plugins
7.2.2 Popular plugins and their use cases
8: Real-world Examples and Case Studies
8.1 Industry-specific Dashboards
8.1.1 IT Operations
8.1.2 DevOps and Continuous Monitoring
8.2 User-submitted Dashboards
8.2.1 Showcasing community-contributed dashboards
8.2.2 Learning from real-world examples
9: Troubleshooting and Common Issues
9.1 Debugging Dashboards
9.1.1 Troubleshooting data source connectivity
9.1.2 Identifying and resolving common errors
9.2 Community Support and Resources
9.2.1 Grafana forums and community engagement
9.2.2 Documentation and additional learning resources
10: Final Project and Certification
10.1 Building a Comprehensive Dashboard
10.1.1 Project guidelines
10.1.2 Peer review and feedback
10.2 Certification Exam
10.2.1 Exam format and requirements
10.2.2 Obtaining the Grafana Dashboards Certification


Reviews
There are no reviews yet.