Description
Introduction
TIBCO Spotfire is a powerful analytics and business intelligence (BI) platform that allows organizations to make data-driven decisions quickly and effectively. This course, TIBCO Spotfire for Business Intelligence: A Comprehensive Guide, provides a deep dive into how to leverage Spotfire’s capabilities to gain actionable insights from data, create compelling visualizations, and perform sophisticated analytics.
Spotfire is widely used for interactive data exploration, dashboarding, and reporting. With this guide, you will learn how to use the platform for both simple and advanced BI tasks, from loading and preparing data to building complex visualizations and performing predictive analytics.
Prerequisites
- Basic understanding of data analysis and business intelligence concepts.
- Familiarity with common data formats (CSV, Excel, databases).
- No prior experience with TIBCO Spotfire is required.
- A computer with TIBCO Spotfire installed or access to a Spotfire Server for practice.
Table of Contents
- Introduction to TIBCO Spotfire
1.1 What is TIBCO Spotfire?
1.2 Key Features and Benefits of Spotfire
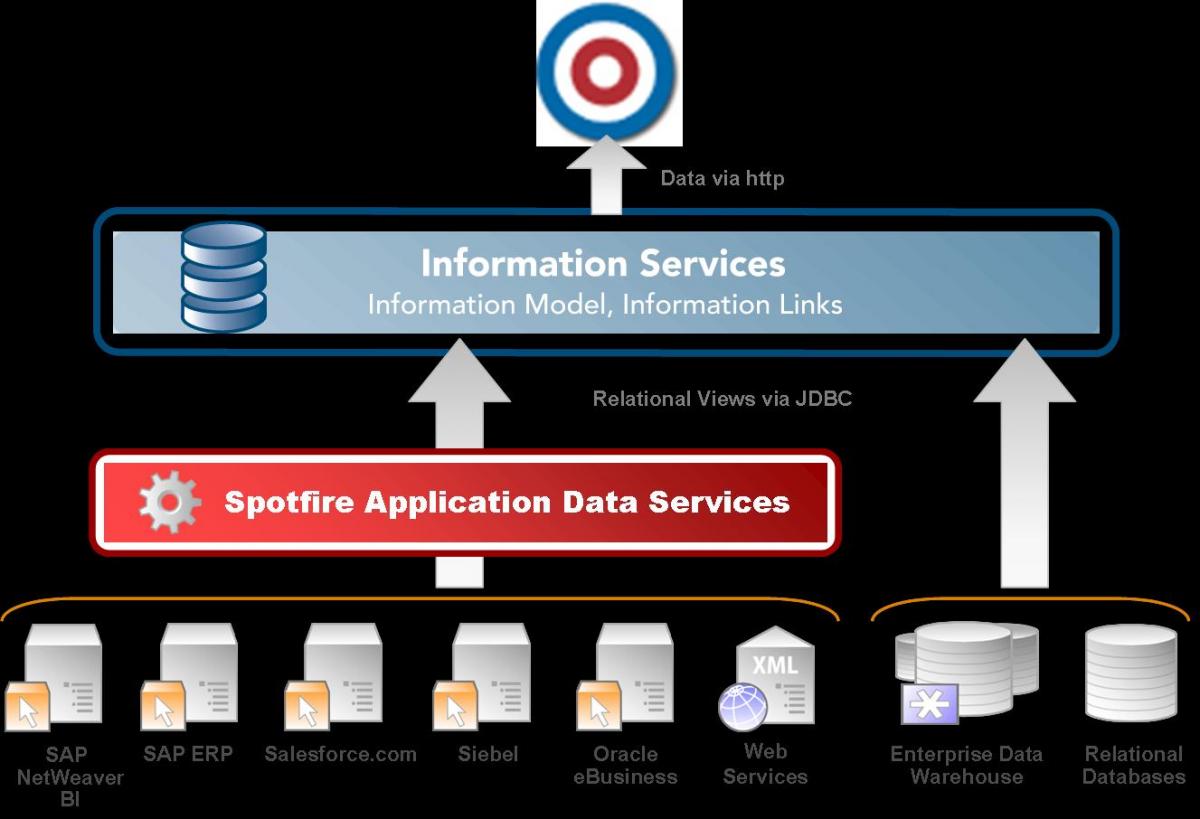
1.3 Overview of Spotfire’s Architecture
1.4 Getting Started with Spotfire: Installation and Setup
1.5 Navigating the Spotfire Interface - Data Loading and Preparation
2.1 Importing Data into Spotfire (Excel, CSV, Database)
2.2 Connecting to Data Sources and Databases
2.3 Data Transformation and Cleaning
2.4 Data Filtering and Sorting
2.5 Handling Missing and Inconsistent Data - Data Visualization in Spotfire
3.1 Understanding Spotfire Visualizations
3.2 Creating and Customizing Basic Visualizations (Tables, Bar Charts, Line Charts)
3.3 Advanced Visualizations: Scatter Plots, Heatmaps, and Geographic Maps
3.4 Interactive Dashboards and Filter Controls
3.5 Working with Multi-Panel Visualizations - Advanced Data Analysis
4.1 Statistical Functions in Spotfire
4.2 Trend Analysis and Forecasting
4.3 Creating Custom Calculations and Expressions
4.4 Data Grouping and Aggregation
4.5 Correlation and Regression Analysis - Spotfire Scripting and Automation
5.1 Introduction to Spotfire’s Scripting Environment
5.2 Automating Tasks with IronPython Scripts
5.3 Customizing Visualizations Using Scripts
5.4 Using Spotfire’s API for Integration
5.5 Best Practices for Scripting in Spotfire - Spotfire Analytics for Predictive Modeling
6.1 Introduction to Predictive Analytics with Spotfire
6.2 Using Spotfire’s Data Mining Tools
6.3 Building and Validating Predictive Models
6.4 Integrating Spotfire with R and Python for Advanced Analytics
6.5 Applying Machine Learning Techniques in Spotfire - Collaboration and Sharing Insights
7.1 Creating Interactive Reports and Dashboards
7.2 Sharing Insights with Spotfire Web Player
7.3 Publishing Reports and Dashboards to the Spotfire Server
7.4 Collaboration Features: Annotations and Commenting
7.5 Exporting Data and Visualizations - Security and Data Governance
8.1 Implementing Role-Based Access Control (RBAC)
8.2 Managing User Permissions and Security Settings
8.3 Data Encryption and Protection in Spotfire
8.4 Auditing and Compliance in Spotfire
8.5 Best Practices for Data Governance in Spotfire - Spotfire Administration and Deployment
9.1 Overview of Spotfire Server Administration
9.2 Managing Users and Licenses(Ref: Python Programming Fundamentals for Beginners: A Comprehensive Introduction)
9.3 Configuring Spotfire Server for Optimal Performance
9.4 Deployment Scenarios and Best Practices
9.5 Troubleshooting and Error Handling - Next Steps with TIBCO Spotfire
10.1 Exploring Advanced Spotfire Features (TIBCO Data Science, Advanced Analytics)
10.2 Integrating Spotfire with Other BI Tools and Data Sources
10.3 Exploring the Spotfire Community and Resources
10.4 Certification and Continuing Education in Spotfire
10.5 Future Trends in BI and Analytics with TIBCO Spotfire
Conclusion
By completing TIBCO Spotfire for Business Intelligence: A Comprehensive Guide, you will have mastered the key features of Spotfire and will be equipped to effectively analyze and visualize your data. Spotfire’s powerful analytics capabilities combined with its easy-to-use interface make it an essential tool for businesses looking to turn data into actionable insights.
The course emphasizes hands-on learning and practical application of concepts, enabling you to build interactive dashboards, automate tasks, and perform advanced predictive analysis. Whether you’re a beginner or someone with some BI experience, this guide will enhance your ability to use TIBCO Spotfire for data-driven decision-making in any industry.





Reviews
There are no reviews yet.