Description
Introduction
SISENSE is a leading business intelligence (BI) platform that enables organizations to simplify complex data analytics, providing real-time insights through interactive dashboards. This course focuses on using SISENSE for creating powerful and visually engaging dashboards. Learners will explore the full range of SISENSE’s capabilities, from connecting and transforming data to designing dynamic, business-driven dashboards that drive decision-making.
By the end of this course, participants will be able to leverage SISENSE as a complete solution for embedding analytics, enabling businesses to visualize data effectively and monitor key performance indicators (KPIs) for strategic goals.
Prerequisites
- Basic understanding of business intelligence concepts
- Familiarity with data visualization tools
- Basic knowledge of data analytics and SQL
Table of Contents
- Introduction to SISENSE
1.1 What is SISENSE?
1.2 Overview of SISENSE Business Intelligence Tools
1.3 Key Features of SISENSE for Dashboard Development
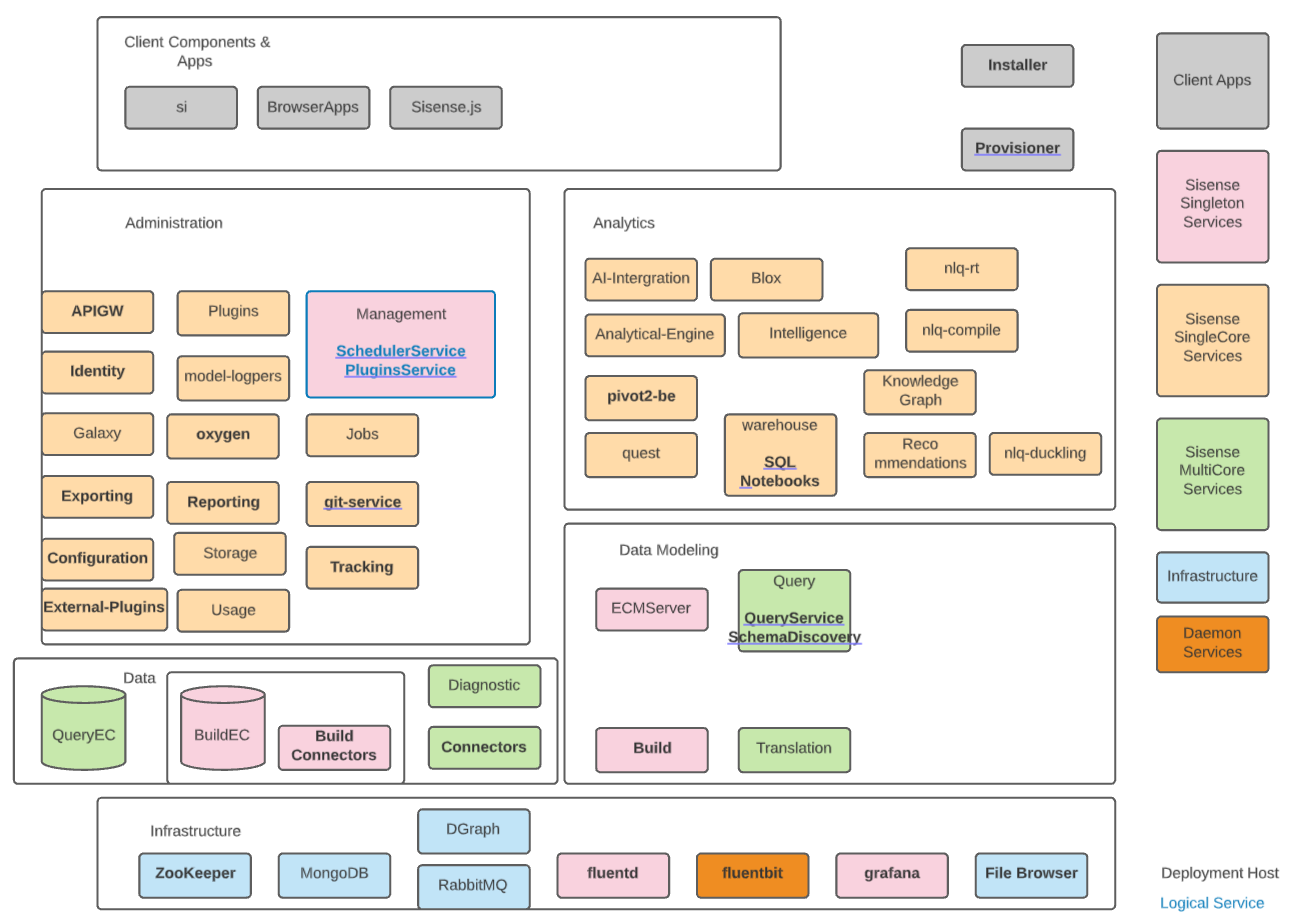
1.4 SISENSE Architecture and Data Flow - Setting Up SISENSE Environment
2.1 Installing and Configuring SISENSE
2.2 Connecting SISENSE to Data Sources (Databases, APIs, Cloud Storage)
2.3 Understanding the SISENSE User Interface
2.4 Managing Users, Roles, and Permissions - Data Integration and Transformation
3.1 Data Import and ETL (Extract, Transform, Load) Processes
3.2 Data Modeling in SISENSE
3.3 Cleaning and Preparing Data for Analysis
3.4 Working with Multiple Data Sources
3.5 Data Join Techniques and Data Blending - Dashboard Design Fundamentals
4.1 Principles of Effective Dashboard Design
4.2 Choosing Visualizations and Widgets(Ref: Oracle Fusion Technical BI: Building Custom Reports)
4.3 Creating Interactive Dashboards for End Users
4.4 Customizing Dashboards with Filters and Drilldowns
4.5 Understanding and Implementing KPIs - Advanced Dashboard Development Techniques
5.1 Using Custom Visualizations and Plugins
5.2 Implementing Real-Time Data Monitoring in Dashboards
5.3 Adding Advanced Features: Geospatial Maps, Heatmaps, and Trend Analysis
5.4 Integrating External APIs and Data Feeds into Dashboards - Embedding Dashboards into Applications
6.1 How to Embed Dashboards in Web and Mobile Applications
6.2 Embedding Dashboards into Third-Party Tools (CRM, ERP, etc.)
6.3 Customizing Embedded Dashboards for Seamless User Experience
6.4 Managing Embedded Analytics and Access Control - Performance Optimization and Troubleshooting
7.1 Optimizing Dashboard Performance for Large Datasets
7.2 Caching Strategies for Faster Data Rendering
7.3 Best Practices for Reducing Latency and Load Times
7.4 Troubleshooting Common Issues in SISENSE Dashboards - Collaboration and Sharing Insights
8.1 Collaborating with Teams Through SISENSE
8.2 Setting Up Alerts and Notifications in Dashboards
8.3 Sharing Dashboards with Stakeholders
8.4 Exporting Dashboards to Different Formats (PDF, Excel, etc.) - Case Studies and Real-World Applications
9.1 Building Dashboards for Financial Reporting
9.2 Dashboards for Sales and Marketing Analytics
9.3 Operations and Supply Chain Dashboards
9.4 Case Study: SISENSE Implementation in a Real Business Scenario - Conclusion and Future Trends in BI Dashboard Development
10.1 Key Takeaways from the Course
10.2 Emerging Trends in Business Intelligence and Data Visualization
10.3 Next Steps in Advancing Your SISENSE Skills
Conclusion
SISENSE BI Dashboard Development is a powerful tool for creating interactive, data-driven dashboards that offer critical business insights. This course will help you master the process of integrating, transforming, and visualizing data to support decision-making. By the end of the training, you will be equipped to build custom dashboards that are visually appealing, interactive, and optimized for real-time data analysis, giving your organization a competitive edge through superior business intelligence.
Mastering SISENSE’s capabilities will not only empower you to deliver actionable insights but also enable you to optimize business processes, enhance reporting, and improve overall organizational performance.


Reviews
There are no reviews yet.