1: Introduction to Zabbix
1.1: What is Zabbix?
1.2: Overview of Open-Source Monitoring
1.3: Key Features and Capabilities of Zabbix
1.4: Benefits and Use Cases for Zabbix
1.5: Installing Zabbix
1.5.1: System Requirements and Architecture Overview(Ref: Software Architecture Foundations)
1.5.2: Installation on Various Platforms (Linux, Windows)
1.5.3: Initial Setup and Configuration
2: Getting Started with Zabbix
2.1: Navigating the Zabbix Web Interface
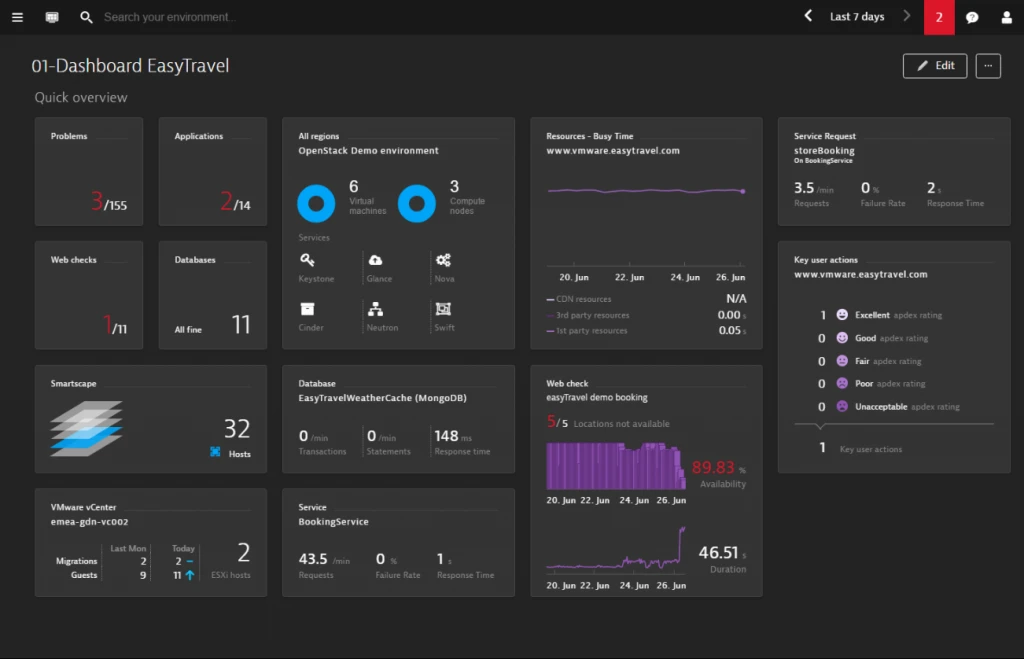
2.2: Zabbix Dashboard Overview
2.3: Customizing User Profiles and Roles
2.4: Managing User Permissions and Groups
2.5: Adding Devices for Monitoring
2.5.1: Discovery of Network Devices
2.5.2: Adding Servers, Network Devices, and Virtual Machines
2.5.3: Configuring SNMP, IPMI, and Agent-Based Monitoring
3: Configuring Hosts and Items
3.1: Setting Up Hosts and Groups
3.2: Defining Host Groups for Logical Organization
3.3: Setting Up Proxies for Distributed Monitoring
3.4: Monitoring Metrics with Items
3.4.1: Configuring Metrics (Items) for Hosts
3.4.2: Choosing Between Agent-Based, SNMP, and JMX Monitoring
3.4.3: Tracking Key Metrics for Network and Server Performance
4: Triggers and Alerts
4.1: Setting Up Triggers
4.2: Defining Trigger Thresholds
4.3: Using Macros in Trigger Expressions
4.4: Creating and Managing Trigger Dependencies
4.5: Configuring Notifications and Actions
4.5.1: Defining Actions for Alerts
4.5.2: Sending Alerts via Email, SMS, or Integration Tools
4.5.3: Escalation of Alerts Based on Severity
5: Visualizing Data with Graphs, Screens, and Maps
5.1: Creating Graphs and Screens
5.2: Visualizing Metrics with Graphs and Screens
5.3: Customizing Graph Templates for Hosts
5.4: Creating Dashboards with Screens and Widgets
5.5: Setting Up Network Maps
5.5.1: Building Custom Network Maps
5.5.2: Visualizing Network Relationships
5.5.3: Real-Time Monitoring on Maps
6: Templates and Macros
6.1: Using and Creating Templates
6.2: Applying Predefined Templates
6.3: Building Custom Templates for Reusability
6.4: Assigning Templates to Hosts and Host Groups
6.5: Working with Macros
6.5.1: Using Global and Host Macros for Flexibility
6.5.2: Best Practices for Macros in Templates and Triggers
7: Performance Tuning and Scaling Zabbix
7.1: Optimizing Zabbix Performance
7.2: Performance Considerations for Large Installations
7.3: Tuning Database Settings for High Availability
7.4: Best Practices for Efficient Polling Intervals and Data Retention
7.5: Scaling Zabbix in Large Environments
7.5.1: Implementing Zabbix Proxies for Distributed Monitoring
7.5.2: Load Balancing and High-Availability Configurations
8: Reporting and Integrations
8.1: Generating Custom Reports
8.2: Setting Up and Customizing Report Templates
8.3: Scheduling Reports for Delivery
8.4: Exporting Reports in Various Formats (CSV, PDF)
8.5: Third-Party Integrations
8.5.1: Integrating Zabbix with Other Tools (e.g., Grafana, Slack)
8.5.2: Zabbix API for Automation
8.5.3: Using Zabbix with Cloud Providers (AWS, Azure, GCP)
9: Security and Maintenance
9.1: Securing Your Zabbix Instance
9.2: Implementing Role-Based Access Control (RBAC)
9.3: Best Practices for SSL and Encryption
9.4: Regular Maintenance for Database and Log Management
9.5: Backup and Recovery
9.5.1: Scheduling Automated Backups
9.5.2: Restoring Zabbix Configuration and Data
10: Conclusion and Best Practices
10.1: Review of Key Takeaways
10.2: Summary of Zabbix Capabilities and Best Practices
10.3: Real-World Use Cases and Success Stories
10.4: Next Steps for Advanced Monitoring
10.4.1: Advanced Zabbix Modules (Event Correlation, Forecasting)
10.4.2: Zabbix Certification Paths and Additional Learning Resources
Reference


Reviews
There are no reviews yet.