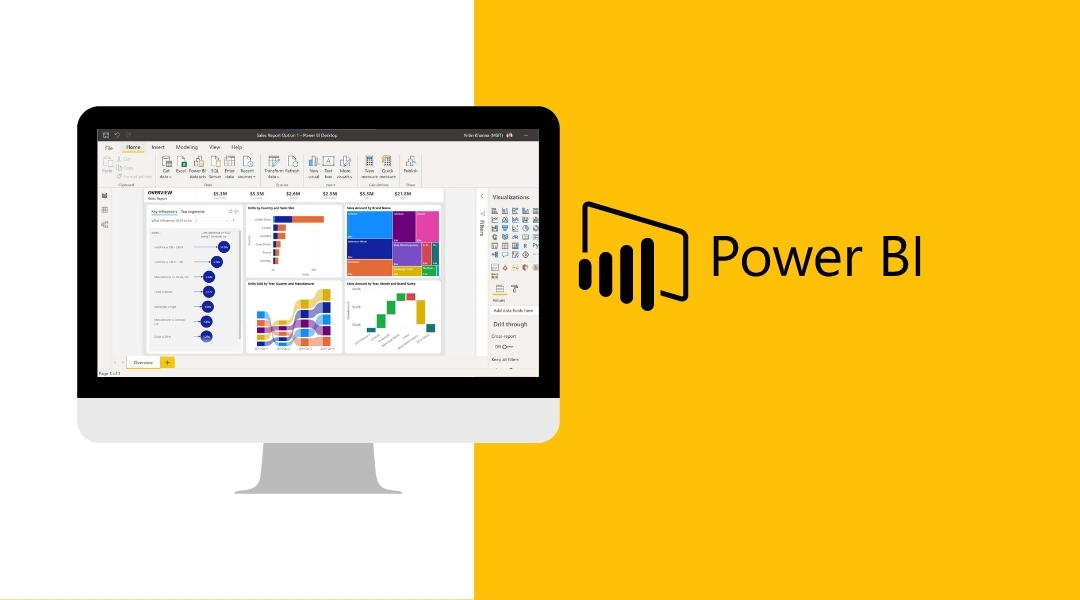
A Power BI Developer is a specialized role within the data analytics and business intelligence (BI) domain, focused on creating and managing data-driven solutions using Microsoft Power BI, a leading BI tool. Power BI Developers are responsible for transforming raw data into meaningful and interactive dashboards, reports, and visualizations that enable organizations to make informed decisions. They work closely with business stakeholders to gather requirements and ensure that the insights provided meet the organization’s analytical and reporting needs.
Power BI Developers play a key role in converting complex datasets into simple, easy-to-understand formats through visually appealing reports. They have a strong understanding of data modeling, data visualization, and the integration of various data sources.
Key Roles and Responsibilities of a Power BI Developer:
-
Data Analysis and Requirement Gathering
- Collaborating with business stakeholders to gather requirements and understand their reporting and analytics needs.
- Analyzing business processes and identifying key metrics and performance indicators that need to be tracked.
-
Data Integration and Transformation
- Integrating data from various sources (databases, cloud services, Excel, etc.) into Power BI.
- Using Power Query to clean, transform, and prepare data for analysis.
- Implementing Extract, Transform, Load (ETL) processes to manage data flows and prepare data for reporting.
-
Data Modeling
- Creating and managing data models in Power BI that allow for efficient querying and reporting.
- Designing and implementing relationships between tables, hierarchies, and data structures for optimal performance.
- Writing and optimizing DAX (Data Analysis Expressions) formulas to compute business metrics.
-
Report and Dashboard Development
- Designing, developing, and maintaining interactive reports, dashboards, and visualizations using Power BI.
- Creating user-friendly, visually appealing dashboards that convey data insights effectively.
- Ensuring dashboards and reports meet business needs by using appropriate filters, slicers, charts, and KPIs.
-
Performance Optimization
- Monitoring and improving the performance of Power BI reports and dashboards.
- Optimizing data models, DAX queries, and visual elements to ensure fast and responsive reports.
-
Security and Data Governance
- Implementing data security measures, including row-level security (RLS) to ensure sensitive data is protected.
- Working with IT and data governance teams to maintain data privacy, security standards, and compliance.
-
Collaboration with Other Teams
- Working with database administrators, data engineers, and other developers to ensure smooth data integration and management.
- Collaborating with business users to deliver ad-hoc reports and support their self-service BI needs.
-
Maintenance and Support
- Maintaining and updating existing Power BI reports and dashboards to reflect new data or changes in business requirements.
- Providing technical support and training to business users on how to use Power BI effectively.
-
Publishing and Sharing Reports
- Publishing Power BI reports to the Power BI service and managing access and permissions for users.
- Collaborating with IT for proper deployment and sharing of reports across the organization.
-
Staying Updated
- Staying updated with the latest Power BI features, functionalities, and best practices.
- Continuously learning and adapting to new data sources, tools, and technologies as required.
Technical Skills:
- Proficiency in Microsoft Power BI (Power Query, Power Pivot, Power View, and Power BI Desktop).
- Strong SQL skills for querying databases.
- Understanding of DAX (Data Analysis Expressions) for advanced data analysis.
- Knowledge of data warehousing and ETL processes.
- Familiarity with data modeling and database design concepts.
- Experience with data visualization techniques and best practices.
- Good problem-solving skills and the ability to work with complex datasets.
Power BI Developer’s Impact:
A Power BI Developer plays a crucial role in helping businesses become more data-driven. By delivering valuable insights through interactive visualizations and reports, they empower decision-makers to make better, informed business decisions that can lead to increased efficiency, productivity, and growth.


