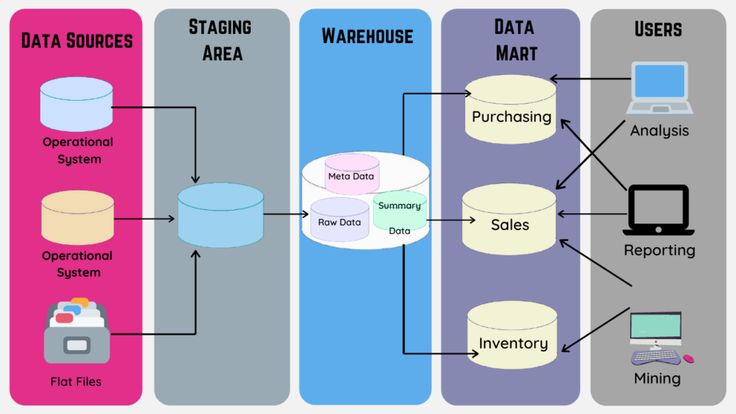
Description
Introduction of QlikView for Interactive Dashboard
QlikView is a powerful business intelligence and data visualization tool that empowers users to transform raw data into meaningful insights. With its intuitive drag-and-drop interface, dynamic dashboards, and associative data model, QlikView enables seamless exploration and analysis of data from various sources.
This course, QlikView Essentials: Building Interactive Dashboards, introduces you to the core features of QlikView, guiding you through creating insightful dashboards that enable data-driven decision-making. Whether you’re a data analyst, business professional, or developer, this training equips you to harness QlikView’s capabilities effectively.
Prerequisites
- Basic understanding of data visualization concepts.
- Familiarity with data structures like tables and relationships.
- Access to QlikView software for practical exercises.
Table of Contents
- Introduction to QlikView
1.1 Overview of QlikView and Its Features
1.2 Understanding the Associative Data Model
1.3 Installing and Setting Up QlikView - Loading and Managing Data
2.1 Connecting to Data Sources
2.2 Loading and Transforming Data
2.3 Understanding Data Models and Tables
2.4 Resolving Data Conflicts and Optimizing Performance - Creating Your First Dashboard
3.1 Setting Up the Dashboard Layout
3.2 Adding Charts and Tables
3.3 Using Filters and Selections(Ref: Visualization with Vectors and Matrices in MATLAB)
3.4 Interactivity: Exploring Data Associations - Advanced Visualization Techniques
4.1 Customizing Charts: Pie, Bar, Line, and Scatter
4.2 Using Gauges, Maps, and KPIs for Dynamic Insights
4.3 Creating Hierarchical Views with Drill-Down Features
4.4 Animating Data for Better Storytelling - Scripting and Data Transformation
5.1 Introduction to QlikView Scripting
5.2 Performing ETL (Extract, Transform, Load) Tasks
5.3 Applying Functions and Calculations in Scripts
5.4 Advanced Scripting for Data Aggregation - Dashboard Interactivity and User Experience
6.1 Designing Dashboards for Usability
6.2 Using Triggers and Actions for Interactivity
6.3 Optimizing Dashboards for Performance
6.4 Exporting and Sharing Dashboards - Security and User Access
7.1 Implementing Security in QlikView Applications
7.2 Role-Based Access Control
7.3 Deploying Dashboards to Users - Case Studies and Real-World Applications
8.1 Creating Dashboards for Sales and Marketing
8.2 Analyzing Financial Data with QlikView
8.3 Operational Dashboards for Business Processes
8.4 Industry-Specific Examples - Best Practices and Troubleshooting of QlikView for Interactive Dashboard
9.1 Tips for Designing Effective Dashboards
9.2 Common Pitfalls and How to Avoid Them
9.3 Leveraging QlikView Community and Resources
9.4 Next Steps for Advanced Learning
Conclusion
QlikView revolutionizes data visualization and analysis, making it an essential tool for professionals across industries. In QlikView Essentials: Building Interactive Dashboards, you’ll master the art of transforming data into actionable insights, equipping yourself to build visually appealing and highly functional dashboards.
This course empowers you to make data-driven decisions, unlock hidden opportunities, and deliver impactful results. By the end, you’ll have the expertise to harness QlikView’s capabilities to their fullest, enhancing your organization’s analytics capabilities.


Reviews
There are no reviews yet.