1. Introduction to Nuix Analytics
1.1 Overview of Nuix Analytics
1.1.1 Understanding the purpose and capabilities of Nuix Analytics.
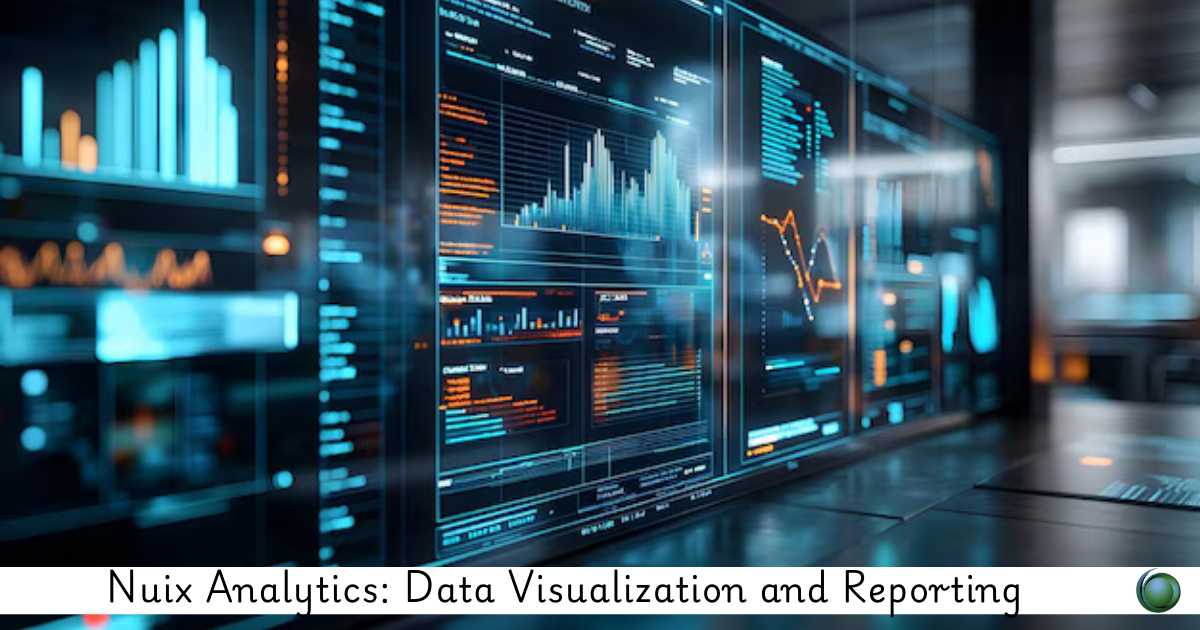
1.1.2 Key features and benefits of using Nuix for data visualization and reporting.
1.2 Navigating the Nuix Analytics Interface
1.2.1 Overview of the user interface and essential tools available.
1.2.2 Customizing the workspace for efficient data analysis.(Ref: Optimizing Performance in Nuix for Large Data Sets)
1.3 Hands-On Activity: Exploring the Interface
1.3.1 Participants will navigate through the Nuix Analytics interface and set up their environment.
2. Data Preparation for Analysis
2.1 Preparing Data for Visualization
2.1.1 Techniques for cleaning and structuring data for effective analysis.
2.1.2 Importance of data integrity and consistency in visualizations.
2.2 Data Transformation Techniques
2.2.1 Using filters and queries to segment data for targeted analysis.
2.2.2 Transforming raw data into meaningful datasets.
2.3 Hands-On Activity: Preparing a Dataset
2.3.1 Participants will prepare a sample dataset for analysis and visualization.
3. Creating Visualizations in Nuix Analytics
3.1 Understanding Visualization Types
3.1.1 Overview of various visualization types (charts, graphs, dashboards).
3.1.2 When to use different visualization formats for maximum impact.
3.2 Building Effective Visualizations
3.2.1 Step-by-step guide to creating visualizations in Nuix Analytics.
3.2.2 Customizing visualizations to align with audience needs.
3.3 Hands-On Activity: Creating Visualizations
3.3.1 Participants will create different types of visualizations using the prepared dataset.
4. Advanced Visualization Techniques
4.1 Leveraging Advanced Features
4.1.1 Exploring advanced visualization options (heat maps, network graphs).
4.1.2 Techniques for enhancing interactivity in visualizations.
4.2 Combining Visualizations for Comprehensive Insights
4.2.1 Best practices for integrating multiple visualizations into a cohesive narrative.
4.2.2 Techniques for using dashboards to present data effectively.
4.3 Hands-On Activity: Creating an Interactive Dashboard
4.3.1 Participants will create a dashboard that integrates multiple visualizations.
5. Reporting in Nuix Analytics
5.1 Generating Reports from Visualizations
5.1.1 Overview of reporting features in Nuix Analytics.
5.1.2 Techniques for compiling visualizations into reports.
5.2 Customizing Reports for Different Audiences
5.2.1 Understanding audience needs and tailoring reports accordingly.
5.2.2 Best practices for presenting data clearly and effectively.
5.3 Hands-On Activity: Creating a Custom Report
5.3.1 Participants will generate a report based on their visualizations.
6. Best Practices in Data Visualization
6.1 Principles of Effective Data Visualization
6.1.1 Key principles to consider for clear and impactful visualizations.
6.1.2 Common pitfalls to avoid in data presentation.
6.2 Storytelling with Data
6.2.1 Techniques for using visualizations to tell a compelling story.
6.2.2 Importance of narrative in data reporting and analysis.
6.3 Hands-On Activity: Enhancing Visuals for Storytelling
6.3.1 Participants will refine their visualizations to enhance storytelling elements.
7. Case Studies and Applications
7.1 Real-World Applications of Nuix Analytics
7.1.1 Exploring case studies where Nuix Analytics made a significant impact.
7.1.2 Discussion of various industries and scenarios benefiting from data visualization.
7.2 Collaborative Data Analysis
7.2.1 Techniques for collaborating with teams using Nuix Analytics.
7.2.2 Sharing visualizations and reports within organizations.
7.3 Hands-On Activity: Analyzing a Case Study
7.3.1 Participants will review a case study and create visualizations based on the data.
8. Wrap-Up and Future Trends
8.1 Review of Key Concepts and Skills
8.1.1 Summary of essential topics covered throughout the training.
8.1.2 Reinforcement of best practices for data visualization and reporting.
8.2 Emerging Trends in Data Visualization
8.2.1 Overview of the latest developments in data visualization technology and methodologies.
8.2.2 Discussing the future of data reporting and analytics in e-Discovery.
8.3 Closing Remarks and Q&A Session
8.3.1 Guidance on further resources and continued learning opportunities.
8.3.2 Open floor for participant questions and feedback.


Reviews
There are no reviews yet.