Description
| Introduction of Looker with Data Visualization:
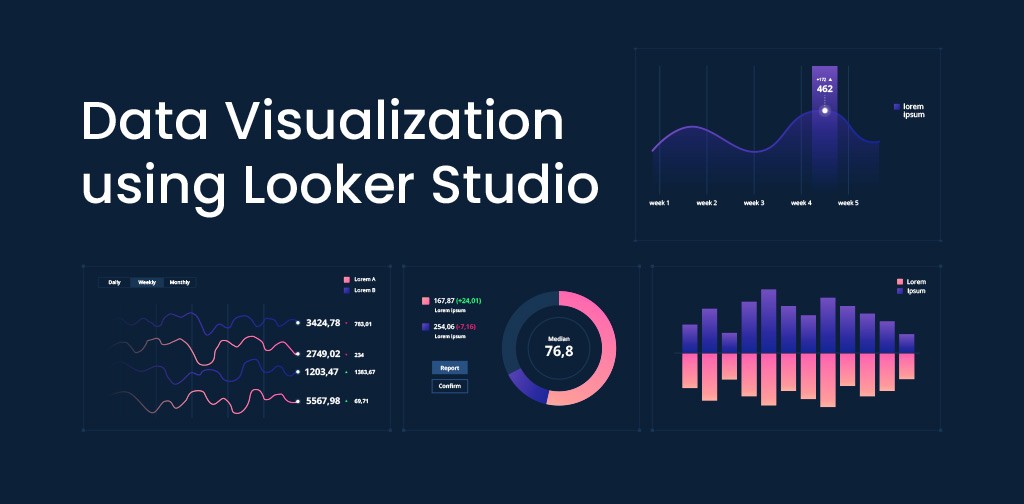
Looker is a business intelligence software and big data analytics platform that helps you explore, analyse and share real-time business analytics easily. It is a one stop solution for all the analytical needs of your organization. It supports Modern BI & Analytics by creating dynamic dashboards for more in-depth analysis and giving teams access to reliable & accurate data that helps in making well informed-decisions. Looker powers Integrated Insights i.e the entire Looker platform works seamlessly with your existing BI setup and in-turn empower your teams to make more effective, data-informed decisions. The Data-Driven Workflows in Looker will definitely save you a lot of time & money by putting your data to work on your business by allowing you to take risk averse decisions backed by real facts about your business. Looker’s platform is agile enough to simulate any workflow. It allows you to create customised applications by providing a purpose built tool that users need, while creating data driven experiences that people love!!! Prerequisites:
|
1. Access Control and Permission Management 1.1 Users and Groups 2. Clustering Looker2.1 Overview 3. Creating Connections Tutorial3.1 General Steps for Creating a Connection 4. Creating Looker Usage Reports with System Activity Explores4.1 Using System Activity Explores for Looker History and Usage Data 5. Aggregate Awareness5.1 Overview Looker with Data Visualization training provides essential knowledge for effectively managing access, optimizing performance, and leveraging Looker’s capabilities for data analysis and reporting. If you are looking for customized info, Please contact us here |


Reviews
There are no reviews yet.